Free Access
Fig. 8
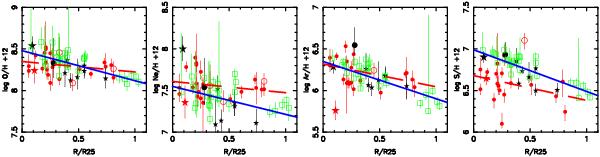
Abundances with respect to hydrogen as a function of the normalized galactocentric radius R/R25. The symbols have the same meaning as in Fig. 4. The continuous blue lines and the dashed red lines represent the straight line fits to the observations of H ii regions and of PNe, respectively.
Current usage metrics show cumulative count of Article Views (full-text article views including HTML views, PDF and ePub downloads, according to the available data) and Abstracts Views on Vision4Press platform.
Data correspond to usage on the plateform after 2015. The current usage metrics is available 48-96 hours after online publication and is updated daily on week days.
Initial download of the metrics may take a while.