Fig. 2
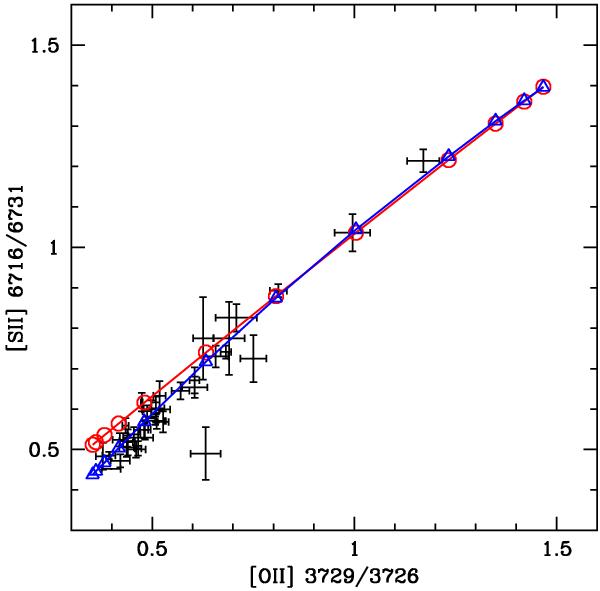
Values of the density indicator [S ii] λ6731/6717 as a function of [O ii] λ3726/3729. Points with error bars: observed values in the sample of PNe by Wang et al. (2004). Continuous lines: lines of equal electron density at a temperature of 104 K from ne = 20 cm-3 (upper right) to ne = 105 cm-3 (lower left). Red: using the [S ii] transition probabilities by Tayal & Zatsarinny (2010). Blue: using the [S ii] transition probabilities from Mendoza & Zeippen (1982).
Current usage metrics show cumulative count of Article Views (full-text article views including HTML views, PDF and ePub downloads, according to the available data) and Abstracts Views on Vision4Press platform.
Data correspond to usage on the plateform after 2015. The current usage metrics is available 48-96 hours after online publication and is updated daily on week days.
Initial download of the metrics may take a while.