Fig. 1
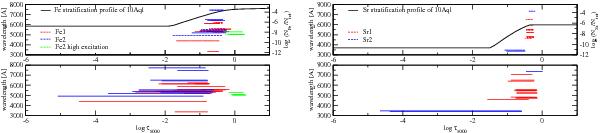
Range of atmosphere depths that contribute most to the formation of selected line profiles, based on contribution functions according to Achmad et al. (1991) for Fe (left column) and Sr (right column). Upper panels show example stratification profile and formation depth ranges of selected lines in a stratified model atmosphere. Lower panels show formation depth ranges for lines in a homogeneous model atmosphere.
Current usage metrics show cumulative count of Article Views (full-text article views including HTML views, PDF and ePub downloads, according to the available data) and Abstracts Views on Vision4Press platform.
Data correspond to usage on the plateform after 2015. The current usage metrics is available 48-96 hours after online publication and is updated daily on week days.
Initial download of the metrics may take a while.