Free Access
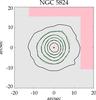
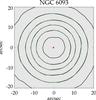
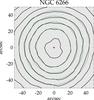
Fig. 2
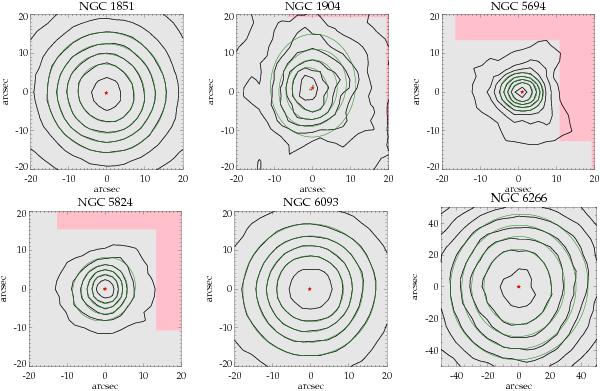
Isodensity contours for the center determination of our sample. The ellipses fitted to four of the contours are shown in green and the resulting center is marked by the red star. The different shades mark the area where the contours can be trusted (gray area) and where they are contaminated by edge effects (pink area).
This figure is made of several images, please see below:
Current usage metrics show cumulative count of Article Views (full-text article views including HTML views, PDF and ePub downloads, according to the available data) and Abstracts Views on Vision4Press platform.
Data correspond to usage on the plateform after 2015. The current usage metrics is available 48-96 hours after online publication and is updated daily on week days.
Initial download of the metrics may take a while.