Fig. 13
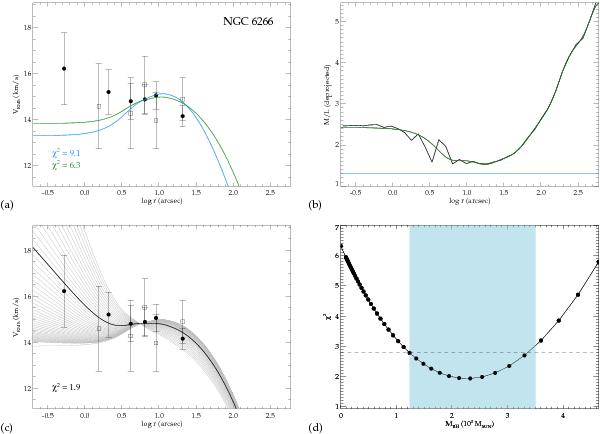
Jeans models, data, and M/LV profile of NGC 6266. All panels and colors are the same as in the previous figures. The M/LV profile (black line in panel b)) is taken from N-body simulations and used as an input for the Jeans models. The green solid line in panel b) shows the parametrization of this profile. The 1σ area of the black-hole mass is visualized as blue shaded area in panel d) as in the previous figures.
Current usage metrics show cumulative count of Article Views (full-text article views including HTML views, PDF and ePub downloads, according to the available data) and Abstracts Views on Vision4Press platform.
Data correspond to usage on the plateform after 2015. The current usage metrics is available 48-96 hours after online publication and is updated daily on week days.
Initial download of the metrics may take a while.