Fig. 12
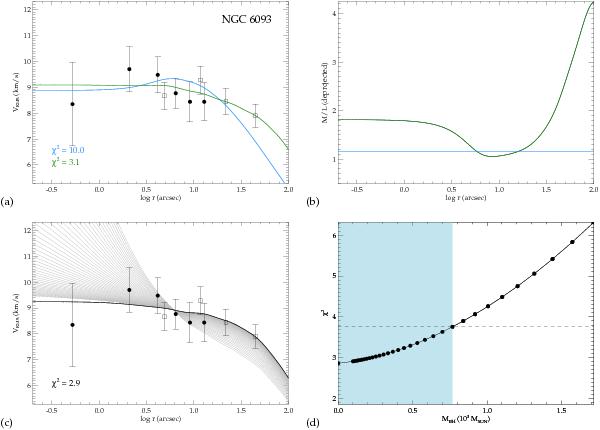
Jeans models for the globular cluster NGC 6093 compared to the datapoints obtained in this work (black bullets) and the outer data points obtained by with the CFHT Fabry-Perot instrument (open squares). Panel a) shows the comparison of a model with (green) and without (blue) fitting a M/LV profile. The corresponding M/LV profiles are shown in panel b). The panels c) and d) show various Jeans models with different black-hole masses and their χ2 values. The best fit model is plotted as a black solid line.
Current usage metrics show cumulative count of Article Views (full-text article views including HTML views, PDF and ePub downloads, according to the available data) and Abstracts Views on Vision4Press platform.
Data correspond to usage on the plateform after 2015. The current usage metrics is available 48-96 hours after online publication and is updated daily on week days.
Initial download of the metrics may take a while.