Fig. 9
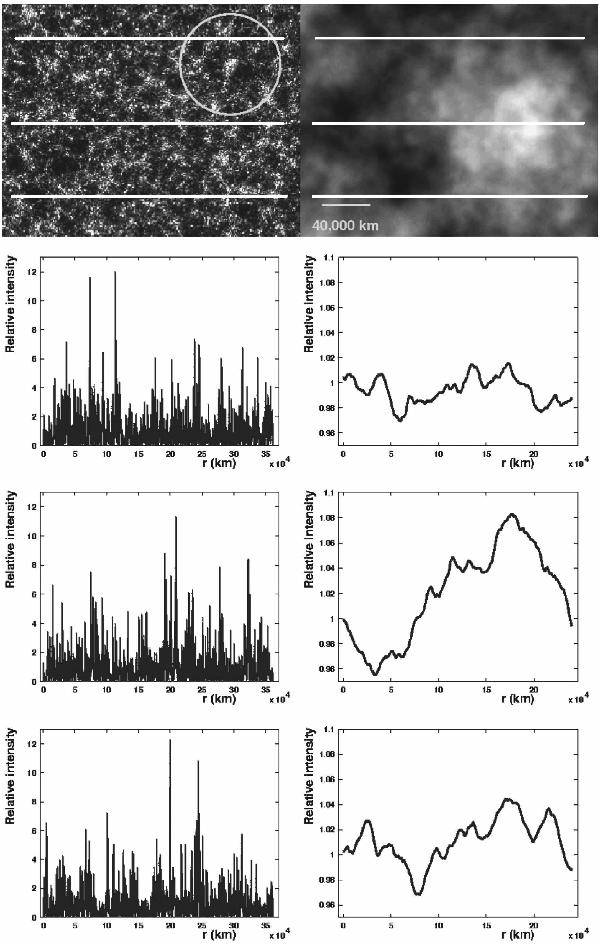
Light curves extracted along the 3 horizontal white lines for two illumination patterns. Left column: 2D pattern from a point-like source in Ks band with Rdiff = 300 km and Rref ≈ 28 000 km. The modulation indices of the three light curves differ by less than 5% from the 2D pattern modulation index. Right column: the illumination pattern for an extended source with Rs ≈ 41 000 km, through the same refractive screen. The modulation indices fluctuate by more than 30% around the 2D pattern index, implying the necessity of longer light curves for a better statistical representativity. The distance scale is common to both patterns. The circle shows the projected star disk. The 3 light curves from the right column are not completely decorrelated, because of their common proximity to the same large positive fluctuation.
Current usage metrics show cumulative count of Article Views (full-text article views including HTML views, PDF and ePub downloads, according to the available data) and Abstracts Views on Vision4Press platform.
Data correspond to usage on the plateform after 2015. The current usage metrics is available 48-96 hours after online publication and is updated daily on week days.
Initial download of the metrics may take a while.