Fig. 8
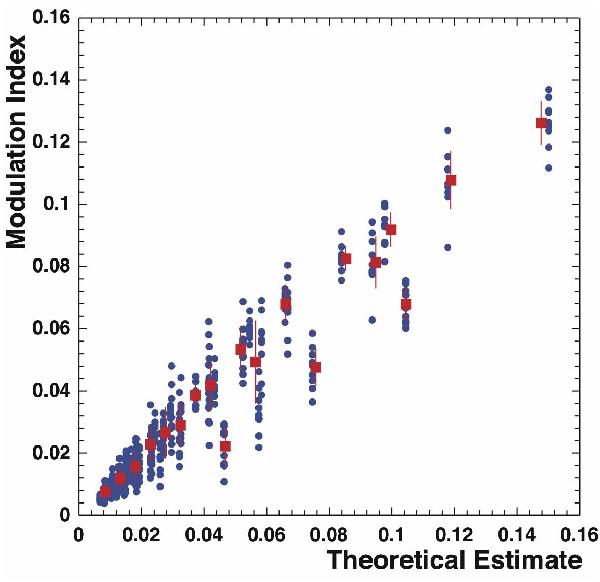
The effective intensity modulation index  for simulated scintillating stellar illumination patterns as a function of the
theoretical modulation index. The blue dots show the effective modulation index values
for different realisations of the phase screens. The red squares represent the mean
value of the effective modulation indices with the same theoretical value. This plot
shows the expected agreement for m < 0.15, a
domain where the simulated screens are large enough not to suffer from statistical
biases (see text).
for simulated scintillating stellar illumination patterns as a function of the
theoretical modulation index. The blue dots show the effective modulation index values
for different realisations of the phase screens. The red squares represent the mean
value of the effective modulation indices with the same theoretical value. This plot
shows the expected agreement for m < 0.15, a
domain where the simulated screens are large enough not to suffer from statistical
biases (see text).
Current usage metrics show cumulative count of Article Views (full-text article views including HTML views, PDF and ePub downloads, according to the available data) and Abstracts Views on Vision4Press platform.
Data correspond to usage on the plateform after 2015. The current usage metrics is available 48-96 hours after online publication and is updated daily on week days.
Initial download of the metrics may take a while.