Fig. 7
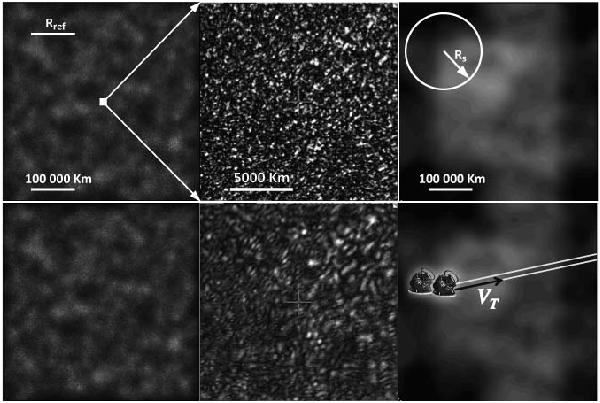
Simulated illumination maps (20 000 × 20 000 pixel of 22.6 km side) produced on Earth by a source located at z0 + z1 = 1.18 kpc through a refracting cloud assumed to be at z0 = 160 pc with a turbulence parameter Rdiff(2.16 μm) = 100 km. Here Rref(2.16 μm) ≃ 100 000 km. Top-left and middle: illumination produced at λ = 2.16 μm from a point-source with a zoomed detail; the contrast is 100%. The grey scale ranges from 0 to 4 times the mean intensity. Top-right: the same from a K0V star (rs = 0.85 R⊙, MV = 5.9, at 1.18 kpc V = 16.3). The circle shows the projection of the stellar disk (RS = rs × z0/z1). Here the modulation index is only 3.3%, and the grey scale ranges from ±20% around the mean intensity. The bottom maps are the illuminations in Ks wide band (λcentral = 2.162 μm, Δλ = 0.275 μm), using the same grey scales as above. The modulation index is 55% for the point-source (left and centre) and 3.3% for the extended source (right). The two parallel straight lines show the sections sampled by two observers located about 10 000 km apart, when the screen moves with the transverse velocity VT.
Current usage metrics show cumulative count of Article Views (full-text article views including HTML views, PDF and ePub downloads, according to the available data) and Abstracts Views on Vision4Press platform.
Data correspond to usage on the plateform after 2015. The current usage metrics is available 48-96 hours after online publication and is updated daily on week days.
Initial download of the metrics may take a while.