Fig. 3
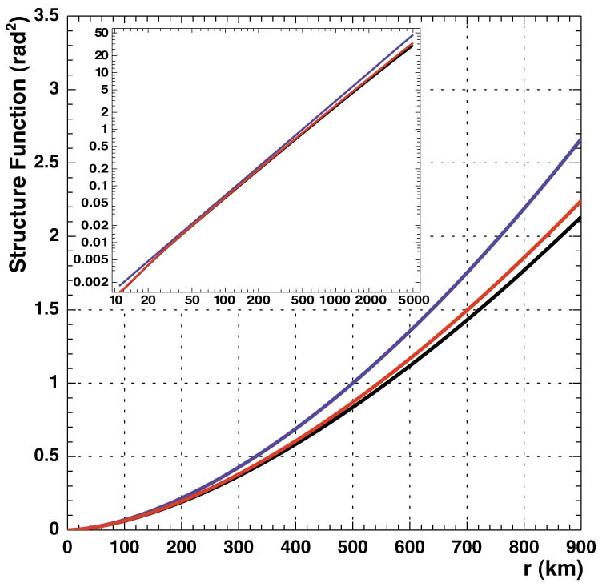
Phase structure functions Dφ(r) for a phase screen with Rdiff = 500 km. Blue line is the initial (theoretical) structure function. Red line is reconstructed from one of the realisations of the phase screen through simulation. The black curve is obtained from the numerical integration of the initial phase spectral density sampled as in the simulation.
Current usage metrics show cumulative count of Article Views (full-text article views including HTML views, PDF and ePub downloads, according to the available data) and Abstracts Views on Vision4Press platform.
Data correspond to usage on the plateform after 2015. The current usage metrics is available 48-96 hours after online publication and is updated daily on week days.
Initial download of the metrics may take a while.