Fig. 2
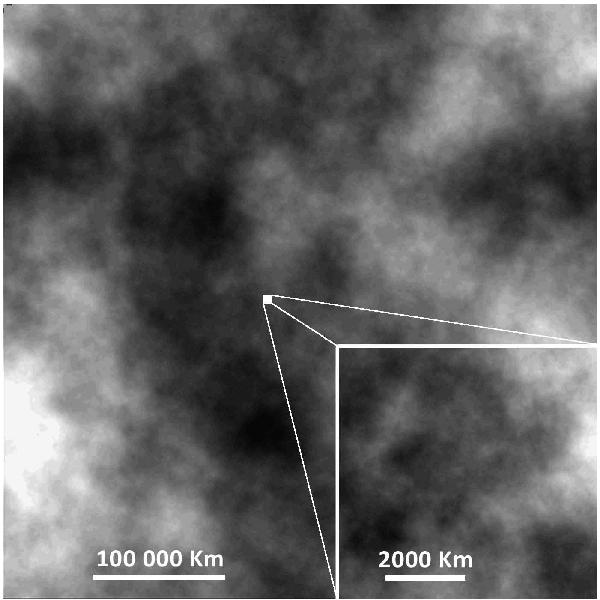
The phase-delay variations near the average for a simulated refractive screen with Nx × Ny = 20 000 × 20 000 pixels, Δ1 = 22.6 km, and Rdiff = 100 km. The grey scale ranges between ± 50 × 2π rad (clear regions correspond to an excess of phase with respect to the average). The zoom (inset in the lower-right corner) illustrates the self-similarity of the simulated screen (grey scale amplitude of 5 × 2π rad).
Current usage metrics show cumulative count of Article Views (full-text article views including HTML views, PDF and ePub downloads, according to the available data) and Abstracts Views on Vision4Press platform.
Data correspond to usage on the plateform after 2015. The current usage metrics is available 48-96 hours after online publication and is updated daily on week days.
Initial download of the metrics may take a while.