Fig. 11
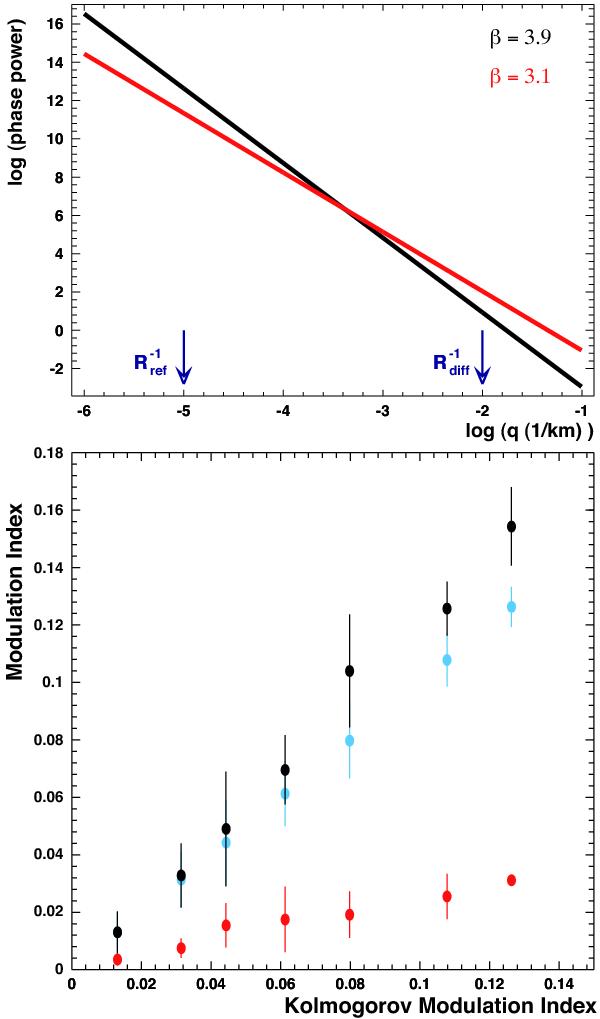
Top: two different phase screen power laws. Bottom: the corresponding modulation indices as a function of the expected modulation index for the Kolmogorov turbulence. The 3 indices plotted at a given abscissa correspond to screens with β = 3.1 (red), 3.67 (Kolmogorov, blue, along the diagonal), and 3.9 (black) with the same Rdiff. As the power law gets steeper, a larger modulation is expected. Blue dots show the Kolmogorov turbulence case.
Current usage metrics show cumulative count of Article Views (full-text article views including HTML views, PDF and ePub downloads, according to the available data) and Abstracts Views on Vision4Press platform.
Data correspond to usage on the plateform after 2015. The current usage metrics is available 48-96 hours after online publication and is updated daily on week days.
Initial download of the metrics may take a while.