| Issue |
A&A
Volume 552, April 2013
|
|
|---|---|---|
| Article Number | A30 | |
| Number of page(s) | 7 | |
| Section | Interstellar and circumstellar matter | |
| DOI | https://doi.org/10.1051/0004-6361/201220086 | |
| Published online | 19 March 2013 | |
An irradiated jet in M 17⋆
1
ESO, Karl-Schwarzschild-Strasse 2,
85748
Garching bei München,
Germany
e-mail:
This email address is being protected from spambots. You need JavaScript enabled to view it.
2
Astronomisches Rechen-Institut, Zentrum für Astronomie der
Universität Heidelberg, Mönchhofstr. 12-14, 69120
Heidelberg,
Germany
e-mail:
This email address is being protected from spambots. You need JavaScript enabled to view it.
3
European Space Astronomy Centre (ESA), PO Box, 78, 28691
Villanueva de la Cañada, Madrid, Spain
e-mail:
This email address is being protected from spambots. You need JavaScript enabled to view it.
Received: 23 July 2012
Accepted: 23 January 2013
Abstract
Context. M 17 is one of the best studied giant HII regions in our galactic neighborhood. It should also provide a suitable environment for the class of fully ionized jets externally irradiated by the presence of nearby hot stars. However, no such jets have been observed thus far in M 17.
Aims. We report on a visible imaging survey of the M 17 nebula with the goal of identifying likely shock-excited nebulosities.
Methods. We imaged M 17 through narrow-band filters centered on the most intense visible lines of [OIII], Hα+[NII], [SII], and Hβ. We obtained follow-up spectroscopy of the only jet-like structure identified in the images. We also used published X-ray observations of M 17 obtained with the Chandra X-ray Observatory, as well as infrared data obtained with the Very Large Telescope and with the Spitzer Space Telescope, to look for evidence of a jet-driving source.
Results. We have detected what appears to be the first jet identified in M 17 visible HII region. The jet is composed of a set of knots, two of which have significant radial velocities with respect to the HII region, and a distant arc-like bright nebulosity that may represent an early episode of intense mass loss by the jet-driving source. The follow-up spectra of the structures composing the jet, including the arc, support this interpretation by revealing intense forbidden lines of [NII] and [SII] due to enhanced collisional excitation in shocks. The presence of a X-ray source, most likely a young stellar object, at a position where the jet launching source should be expected to lie reinforces the interpretation. We identify a tentative near-infrared counterpart of the X-ray source, although it is offset by 1".9 from the nominal position of the X-ray source, which is almost three times the radius of its positional uncertainty. The very weak [OI] emission in the spectra of the jet knots and the arc suggests that they are nearly fully ionized, in agreement with the environment in which the jet is propagating.
Key words: Herbig-Haro objects / HII regions / ISM: individual objects: M 17 / ISM: jets and outflows
Based on observations obtained with the IAC80 telescope operated on the island of Tenerife by the Instituto de Astrofísica de Canarias in the Spanish Observatorio del Teide, and with the ESO New Technology Telescope (NTT) at the Observatory of La Silla (Chile) under observing program 089.C-0189. This work also uses data downloaded from the ESO Science Archive Facility, originally obtained under observing run 69.C-0303(A).
© ESO, 2013
1. Introduction
Jets ejected by young stellar objects, visible as Herbig-Haro (HH) objects, are ubiquitous features of star formation at low and intermediate masses (Reipurth & Bally 2001; Bally 2007, 2009; Ray 2007). The typical picture of a jet involves a solar-type or low-mass star in its early evolutionary stages residing in a molecular cloud, still surrounded by vast amounts of circumstellar dust and a massive disk, launching a collimated outflow that becomes visible thanks to the emission of its collisionally excited gas. The majority of known HH objects reside in low-mass star-forming regions, and numerous examples are found in the nearest star-forming clouds.
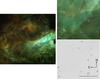 |
Fig. 1 Left: composite of the M 17 mosaic obtained with the IAC80 telescope. In the color figure reproduced in the electronic version of the journal, blue corresponds to emission in the [OIII] filter, green in the Hα filter, and red in the [SII] filter. The area covered is , with north to the top and east to the left. The yellow square indicates the area enlarged in the panels on the right, which contains the structures described in this paper, including three emission knots near the upper right corner and the bright arc-shaped nebula near the bottom left. For reference, an image in the narrow-band continuum adjacent to Hα is included at the bottom right showing stellar sources in the field. Both the knots and the arc are best seen in Fig. 2. |
HH objects are present in regions that form massive stars as well, with several documented examples in regions like the σ Ori aggregate (Reipurth et al. 1998; Andrews et al. 2004), the Orion Nebula (Bally et al. 2001), the North America/Pelican nebulae complex (Bally & Reipurth 2003), the Trifid Nebula (Yusef-Zadeh et al. 2005), the Lagoon nebula (Barbá & Arias 2007), or the Carina nebula (Smith et al. 2010). Most of the known sources launching the jets in such regions belong to the low-mass stellar component and are thus similar to those responsible for the phenomenon in the regions that lack massive stars. However, the physical conditions of the jets are substantially modified by the ultraviolet radiation from nearby hot stars. In such irradiated jets (Bally 2007) photoionization dominates the collisional ionization, making HH objects more prominent by increasing the degree of ionization of the hydrogen. Irradiated jets near O-type stars are elusive owing to the greater distances to the massive star formation regions where they reside and to the brightness of the host nebula in the same emission lines as produced in jets, which require high spatial or spectral resolution to be detected. Intrinsic factors, such as the fast erosion of the jets and the circumstellar gas reservoirs that feed them by the combination of strong winds and ultraviolet radiation from the nearby hot stars, are likely to play a role as well.
M 17 is a well-studied giant HII region, located at 2.1 kpc from the Sun (Chini & Hoffmeister 2008). The visible nebula lies next to a giant molecular cloud that contains a partly embedded cluster rich in O stars (Hanson et al. 1997; Hoffmeister et al. 2008). Abundant hot, X ray-emitting gas pervades the region (Townsley et al. 2003). X-rays also reveal an abundant population of solar-type and low-mass stars (Broos et al. 2007) scattered over the area of the nebula. Despite the evidence of ongoing star formation, no HH objects had been reported thus far in the HII region. A molecular jet was found in the embedded cluster by Nürnberger et al. (2007) driven by a very young and massive stellar object surrounded by an extended, edge-on disk-like structure (Chini et al. 2004). However, the estimated masses of the central object and the disk keep this object from being representative of typical HH objects. Indirect evidence for other bipolar outflows in the embedded cluster has recently been provided by Chen et al. (2012).
In this paper we report the serendipitous detection in narrow-band imaging of what appears to be an irradiated jet near the center of the M 17 visible HII region. Spectroscopic follow-up supports this interpretation and allows us to derive radial velocities and estimate the densities of jet knots. We also discuss existing indications of a candidate driving source identified in X-ray observations.
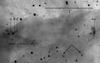 |
Fig. 2 R-band image obtained with the NTT of the knots and the arc, aligned in the horizontal direction parallel to the position of the slit in our spectroscopic observations. The position given by Broos et al. (2007) for the X-ray source CXOU J182100.5-161213, which is a candidate jet-driving source, is shown. CXOU J182100.5-161213 is the only X-ray source detected in the entire field. |
2. Observations
2.1. Imaging
We carried out imaging observations of four overlapping fields that cover most of the area of the M 17 giant HII region using the CAMELOT CCD camera mounted on the IAC80 telescope at the Observatorio del Teide (Canary Islands, Spain). The observations took place between 15 and 19 July 2011 under grey and bright moon conditions. For each field, 4 dithered images of 15 min exposure time each were obtained through the narrow-band filters respectively covering the lines Hα + [NII]λ6548 + [NII]λ6583, [SII]λ6716 + [SII]λ6731, and a continuum filter to the red of Hα. In addition, four images of each field of 30 min each were obtained through a filter covering the [OIII]λ4959 and [OIII]λ5007 lines, as well as one image of 30 min per field in the Hβ filter.
The nebulosity and the stellar images in the area where all fields overlap were used as references to correct each bias-subtracted, flat-fielded image for variations in the sky background level and in the sky transparency. The corrected images were then combined into a mosaic covering , shown in the left hand panel of Fig. 1. Image reduction and combination was carried out using dedicated IRAF1-based scripts.
Upon visually inspecting the frames in each narrow-band filter, we noticed a peculiar chain of three fairly well-aligned knots most clearly seen in our Hα+[NII] and [SII] images, although also traceable in the Hβ and [OIII] images. An extension of the line defined by the knots to the southwest intersects another singular feature, an arc-shaped bright nebula that stands out in the Hα+[NII], Hβ, [SII], and [OIII] images. Its concavity points to the direction of the knots. Hints of concavity can also be discerned, although on a smaller scale, in the knots. As the images show, the area of M 17 where this structure is located contains other crescent-shaped nebulae that trace the bright rims of high-density condensations externally illuminated by the cluster of O stars that ionize the HII region. However, the arc-shaped nebula at the end of the jet stands out because of an orientation of its concavity that is almost opposite to what is expected if it also traced the edge of a condensation, and the images provide no indication of a high-density condensation of which that nebula could be a rim. The particular spatial alignment of these features along a straight line, together with the orientation of the arc, lead us to consider that the knots and the arc-shaped nebula are probably related parts of a single structure caused by a jet propagating in the M 17 HII region. A careful visual inspection of the mosaic in each filter does not reveal any other similar structures in the entire imaged field. Unfortunately, the structures cannot be seen in red plates of the Palomar Observatory Sky Survey owing to the overexposure of the nebula, and we have not been able to locate any other decades-old photographic images of M 17 allowing us to attempt the measurement of proper motions.
2.2. Spectroscopy
To further investigate the nature of the knots and the arc-like nebula described above, we obtained a long-slit spectrum simultaneously covering all those structures using the EFOSC2 camera and spectrograph at the ESO New Technology Telescope on the night of 17 to 18 April 2012. The grism and slit combination used cover the range from 6050 Å to 7100 Å at a resolution λ/Δλ = 2400, which is sufficient to clearly detect typical radial velocities of the gas in a Herbig-Haro object unless its axis happens to be closely aligned with the plane of the sky. The spectrum consists of a single exposure of 30 min of duration. In addition to bias and spectroscopic flat field frames, a short spectrum of the spectrophotometric standard LTT7379 (Hamuy et al. 1992) was obtained in order to carry out relative flux calibration.
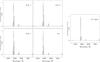 |
Fig. 3 Spectra of the three knots and the arc-like feature, as well as of a representative point in the nebula located roughly half way between knot C and the arc, showing the enhanced [NII] and [SII] emission with respect to Hα in the knots and the arc as compared to the surrounding nebula. The weak [OI] emission line in the spectrum of nebula is almost entirely of telluric origin |
The R-band acquisition image (Fig. 2) obtained previous to the spectrum clearly shows our targets. In it we label the three knots as A, B, C, and the arc-shaped nebula on the southeastern extension of its axis as “the arc”. The extracted spectrum at each position is displayed in Fig. 3, together with a spectrum of the HII region in a representative area away from the knots. A spectrum of the nebula at a nearby position along the slit visually deemed to be free of knot emission has been subtracted from the spectrum of each knot and the arc. The spectra of the knots and the arc presented in Fig. 3 therefore represent knot emission alone, essentially uncontaminated by emission from the nebula and from the sky. Since no separate spectrum was obtained at a position away from the HII region, it was not possible to subtract the sky emission from the spectrum of the nebula presented in Fig. 3. However, considering that [OI] emission at 6300 Å is by far the strongest telluric emission line in the range covered by our spectra, Fig. 3 shows that the telluric contribution to the main nebular lines (Hα, [NII]λ6548, [NII]λ6583, [SII]λ6716, and [SII]λ6731) is negligible. The same is true for the fainter lines of [SIII]λ6312 and HeI λ6678, where no telluric emission is expected. Therefore, the spectrum of the HII region presented in Fig. 3 can be considered to essentially contain only nebular emission, with the exception of the [OI]λ6300 line that is dominated by telluric emission.
3. Results
3.1. Spectrum
The spectrum of the M 17 HII region has been analyzed and discussed in detail by Esteban et al. (1999) and García Rojas et al. (2007) using deep high-resolution spectroscopy covering the entire visible range. Derived electron densities ne in the areas probed by them, which are closer to the embedded cluster, are in the range of a few hundred per cm-3, which is similar to the densities that we derive from the [SII] 6716/6731 ratio (Osterbrock 1989) in the HII region between the knots and the arc. This ratio also shows clearly that the knots and the arc are strong density enhancements, while the measured wavelengths of the [NII] and [SII] lines reveal a blueshift in knots A and C with respect to the underlying nebula that can already be perceived in the raw two-dimensional spectra. A marginal blueshift is also measured in the arc. The radial velocities and the derived densities are listed in Table 1. The generally low radial velocities suggest that the jet is propagating in a direction near the plane of the sky. That is the most favorable orientation for detecting a jet, because the dense layers produced by shocks along its axis are seen close to edge-on and their column densities along the line of sight, hence brightness, are highest.
The most obvious feature of the spectra shown in Fig. 3 is the enhanced intensity of the forbidden lines of [NII] and [SII] with respect to Hα in the knots and the arc in comparison with the HII region, whereas photoionization alone would tend to decrease the [NII]/Hα and [SII]/Hα ratios with increasing density (Stasińska 1982). The strength of the [NII] and [SII] lines thus indicates the existence of high-temperature regions in the knots and the arc where the collisional excitation rate of the ground levels of those species is enhanced, thus providing a strong indication of shock heating of the gas to temperatures that are significantly higher than those attained through photoionization in the rest of the HII region.
Positions, velocities, and densities of the knots.
Line intensities (normalized to Hα = 1000).
The evidence of shock heating lends strong support to our interpretation of the knots and the arc as components of a jet, but significant differences exist between their spectra and those of typical HH objects. Table 2 gives the relative intensities normalized to Hα of the lines measured in the range covered by our spectra. The [SII]/Hα ratio is higher than in high-excitation HH objects (e.g. Schwartz 1983), and [OI] emission is very nearly absent from our spectra. These differences can be readily explained by the ultraviolet irradiation of the knots in M 17 causing the almost complete ionization of oxygen and hydrogen. Indeed, our spectra are much more similar to those of other irradiated jets like HH 444 (Reipurth et al. 1998). An alternative explanation for high [SII]/Hα and [NII]/Hα ratios not involving shocks might be the existence of self-shielded cores at the centers of the knots with a ionization fraction significantly below unity, thus decreasing the intensity of Hα with respect to [NII] and [SII], as proposed in other cases by Bally & Reipurth (2001). However, the virtual lack of [OI] emission, which is a good tracer of neutral hydrogen because of their very similar ionization potentials, indicates that all the structures discussed here are fully ionized.
While the spectra provide direct measurements of line ratios involving the lines in the covered wavelength range, they can also be used in combination with the Hβ and [OIII] images to obtain quantitative estimates of ratios involving lines of the latter species. Taking as a reference the stellar images in the region and assuming that their intensity emitted per unit wavelength is essentially the same at the wavelengths of the Hβ and the [OIII] lines, it is straightforward to estimate the [OIII]/Hβ line ratio from the relative intensities of the images of the knots and the arc in each of those narrow bands. The images of the knots, especially knot B, are very faint in Hβ, and we derive [OIII] /Hβ ~ 2.0 ± 0.8 for them. The arc is brighter in both narrow bands, and we obtain [OIII] /Hβ ~ 2.1 ± 0.3 at the position of its peak brightness. The extinction-corrected ratio [OIII]/Hα can then be obtained from the ratio of intensities between the Hα and Hβ images, considering that the intrinsic ratio of intensities of both lines under a broad range of physical conditions is very approximately 2.85 (Osterbrock 1989). The Hα intensity cannot be directly obtained from the images, since the filter used also includes the [NII]λ6548 and [NII]λ6583 lines, but the correction factor Hα/(Hα+[NII]) giving the fraction of intensity due to Hα alone can be computed for each knot by using the intensities of the [NII] lines with respect to Hα measured in the spectra. This is the procedure that we have followed to provide an estimate of the intensity of the [OIII] lines in Table 2.
3.2. Morphology
The series of knots ending in a large arc-shaped structure is vaguely reminiscent of the Herbig-Haro object HH 34S (e.g. Raga et al. 2012), which is defined by a string of closely spaced knots defining a jet and a much larger, crescent-shaped nebula beyond the end of the jet whose apsis points away from it. However, the jet in M 17 appears to be less collimated, and the knots are much less closely spaced than in HH 34S. In that regard, the string of knots forming the system HH 228/HH 989, associated with the extreme T Tauri star Th 28 in Lupus 3 (Comerón & Fernández 2011), is a closer match to the system formed by knots A to C. If placed at the distance of M 17, the individual knots composing HH 228/HH 989 would have typical sizes around ~2′′, thus appearing marginally resolved in our images, and separations between consecutive knots around ~ , comparable to the spacing between features A, B, and C. One of them, HH 989 C, is a very likely component of the system of knots, but it lies away from the axis and has a proper motion different from that of the other knots, perhaps being an analogous of knot B (slightly off-axis and with a radial velocity similar to that of the HH region) in the system reported here.
At the distance of M 17 the projected length of the jet from knot A to the arc is a sizeable 0.85 pc, well below the length of giant outflows (Reipurth & Bally 2001) but remarkably long for an irradiated jet when considering that the high sound speed in the fully ionized outflowing gas causes its fast expansion in a direction that is transverse to the jet. This is qualitatively consistent with the short length of the jet between knots A and C (0.08 pc projected distance) and its non-detection beyond knot C. On the other hand, both the prominence of the arc and its large distance to knots A to C suggest that the arc was formed in a major ejection in the past that is different from the more recent outflow activity giving rise to the knots, which was able to form a massive dense concentration that has preserved its entity until the present. Its relatively low density with respect to knots B and C, its large extent perpendicular to the jet axis, its low radial velocity, and the lower degree of collisional excitation of the metastable excited levels of NII and SII (the [NII]/Hα and [SII]/Hα ratios drop by 30−40% between the knots of the arc), all suggest that the arc has been significantly decelerated with respect to the knots and is in the process of dissolving in the HII region.
Reipurth et al. (2010) proposed that giant arcs in jets may be formed as a consequence of the disruption of a triple system as a consequence of the dynamical interaction among its components, leaving behind a tighter binary system with highly eccentric orbits. In this scenario the giant arcs are a relict of the triple system disruption, while the subsequent knots are produced at the times of the periastron passages of the remaining binary.
3.3. A possible driving source
Even though driving sources of irradiated jets tend to be less embedded than those in non-irradiated environments (Reipurth & Bally 2001), images of M 17 do not show any point sources along the northwestern extension of the jet that could be identified as the candidate source of the outflow. However, one of the X-ray sources discovered with the Chandra X-Ray Observatory reported by Broos et al. (2007), CXOU J182100.5-161213 (RA(2000) = 18:21:00.53, Dec(2000) = − 16:12:14.0), is located only 5′′ northwest of knot A and precisely on the jet axis. Its position is marked in Fig. 2.
Given the strong coronal activity usually accompanying the early phases of low-mass stellar evolution (Feigelson & Montmerle 1999), which results in young stellar objects being intense X-ray emitters, CXOU J182100.5-161213 should in principle be a good candidate jet-driving source. However, this is one of the 115 Chandra sources in the region for which no near-infrared counterpart could be identified by Broos et al. (2007). We independently investigated the possible existence of such a counterpart by retrieving images in the J, H, and KS bands of the field obtained with the ISAAC infrared imager and spectrograph at the Very Large Telescope (VLT) from the ESO Science Archive Facility. We confirm that no source appears within the positional error circle of CXOU J182100.5-161213 (whose radius is  ) down to 5σ magnitude limits of J = 18.8, H = 17.1, KS = 18.0. However, there are two point sources within 2′′ of the nominal position of CXOU J182100.5-161213 having KS = 14.28, (J − H) = 0.92, (H − KS) = 0.43, and KS = 14.55, (J − H) = 2.00, (H − KS) = 0.93, which thus have normal colors of moderately obscured stars with no indications of the near-infrared excess caused by the circumstellar material that is common around very young stellar objects. Furthermore, neither of those stars indicate any mid-infrared excess at wavelengths between 3.6 μm and 8 μm in images retrieved from the archive of the Spitzer Space Telescope obtained for the GLIMPSE galactic plane survey (Churchwell et al. 2009). No other candidate driving sources are found near the position in the Spitzer images with the rising spectral energy distribution characteristic of Class 0 or Class I sources typically driving outflows. The very bright background caused by the HII region at wavelengths longer than 24 μm (the area near the base of the jet appears saturated in the 70 μm GLIMPSE images) prevents us from obtaining any meaningful limits on the flux of a possible driving source at such long wavelengths, but the point-source detection limits in the Spitzer IRAC bands that we estimate range from 0.4 mJy at 3.6 μm to 7 mJy at 8.0 μm, which are in principle sensitive enough to detect low-mass Class 0 or Class I sources near the expected location of the driving source. Comparing this with the IRAC fluxes of the sample of Class I sources in Taurus-Auriga compiled by Robitaille et al. (2007), we estimate that the detection limit lies roughly between the fluxes that IRAS 04169 + 2702 and IRAS 04248 + 2612 would have if they were located at the distance of M 17. This provides only a very rough upper limit on the mass and luminosity of a possible driving source, because even the fits of Robitaille et al. (2007) for the two Taurus-Auriga sources, which are based on a much longer wavelength baseline, yield estimates that are uncertain by nearly one order of magnitude in both luminosity and mass for IRAS 04169 + 2702 and even higher for IRAS 04248 + 2612. Not detecting it in Spitzer observations thus cannot entirely exclude the existence of an embedded Class 0 or Class I driving source.
On the other hand, the X-ray properties of CXOU J182100.5-161213 derived by Broos et al. (2007) would lead us to expect that a young stellar object counterpart should be detectable at its position. Its extinction-corrected X-ray luminosity between 0.5 and 8 keV amounts to log LX(erg s-1) = 31.12, and the foreground extinction is estimated to be AV ≃ 11 mag, which should dim the K-band magnitude by little more than one magnitude. X-ray to bolometric luminosity ratios for young stellar objects can reach values as high as log (LX/Lbol) ~−2 (e.g. Barrado et al. 2011). Therefore, for an object not obscured by a massive disk or envelope (which would reveal itself as an infrared excess that is not detected in either VLT or Spitzer images), we would roughly expect a luminosity Lbol > 1 L⊙ and thus KS ≲ 15 at the distance of M 17, assuming a typical temperature Teff = 4000 K for a solar-luminosity star with an age of a few hundred thousand of years (D’Antona & Mazzitelli 1994) and a bolometric correction BCK ≃ 2.5. We note that the second near-infrared possible counterpart mentioned above, hereafter referred to as VLT J182100.4-161213 to clearly distinguish it from the X-ray source, has both KS magnitude and extinction (for which we estimate AV ≃ 12.8 from the observed (J − H), (H − KS) colors) consistent with the expected properties of the driving source, if the positional offset of  with respect to CXOU J182100.5-161213 is deemed acceptable. We note that, although the positional uncertainly of CXOU J182100.5-161213 quoted by Broos et al. (2007) is , this source lies on the outskirts of the area imaged by the Chandra ACIS instrument, thus having a degraded point-spread function with respect to emitters near the center of the field. If VLT J182100.4-161213 is indeed the counterpart of the X-ray source, the estimated luminosity from its infrared photometry is Lbol ≃ 2 L⊙ at the distance of M 17, and therefore log (LX/Lbol) ≃ −2.8. Its lack of mid-infrared excess emission does not rule out its identification as the candidate driving source, since Reipurth & Bally (2001) note that photoablation of the envelopes of jet-driving sources often seems to take place before the end of the jet-launching phase. Furthermore, if the arc-shaped nebula is the result of the disruption of a triple system as suggested in Sect. 3.2, the strong perturbation of the circumstellar disks of the components of the binary system caused by their close passages may also account for the lack of infrared excess of the tentative driving source of the M 17 jet. We should stress, however, that being at very low galactic latitude the entire region appears very crowded in near-infrared images and that the possibility that the positional proximity between CXOU J182100.5-161213 and VLT J182100.4-161213 may be a mere chance alignment cannot be ruled out.
An alternative possibility to consider is that the observed X-ray emission may not be caused by coronal activity in the photosphere of the driving source, but may be formed instead at a standing shock near the basis of the jet and spatially detached from the driving source, as has been proposed for HH 154 (Schneider et al. 2011). This might account for the detectability of the X-ray emission while the driving source remains too deeply embedded for detection above the flux limits in the 3.6−8.0 μm range discussed above. Finally, given its X-ray spectral characteristics and the uncertainty about its infrared counterpart, CXOU J182100.5-161213 might also be a background active galactic nucleus (AGN) instead of a young stellar object. After taking extinction by the thick intervening column of galactic interstellar medium in the direction of M 17 into account, Broos et al. (2007) estimate that some 20 such objects may be present in their Chandra images, which cover a 17′ × 17′ field of view. While this makes the AGN explanation plausible in principle, the chance coincidence of such an object right at the precise location expected for the jet-driving source is certainly an extremely unlikely event. This leads us to consider that CXOU J182100.5-161213 should still be considered when trying to identify the jet driving source, and the nature of VLT J182100.4-161213 as its possible counterpart should be further investigated.
4. Summary and conclusions
The results presented in this paper report the likely discovery of the first irradiated jet in M 17 and an assessment of its properties. The jet is mainly revealed by its emission in narrow-band Hα, [OIII], and [SII] images. It is composed of a short string of aligned knots 8′′ long, as well as a more distant, prominent arc-shaped structure located 89′′ from the knots, with the concavity pointing away from them, and well aligned with their axis. Given its location and shape, we consider the arc as a part of the same structure. Spectroscopy of the knots and the arc shows significantly higher [NII]/Hα and [SII]/Hα ratios with respect to the surrounding HII nebula, indicating enhanced collisional excitation due to the presence of shocks. The jet is completely ionized, as shown by the virtual absence of [OI] emission. Two of the jet knots have significant negative radial velocities with respect to the surrounding nebula, although this is not the case of the arc. We interpret the latter as the vestige of a past major outburst, now largely decelerated and perhaps associated with a major event in the driving source like the disruption of a triple system.
The driving source of the jet remains inconclusive. An X-ray source is precisely located on the axis of the jet and only 5′′ away from the first of the knots, and a possible near-infrared counterpart is identified from its nominal position. The near-infrared fluxes of the counterpart are consistent with a pre-main sequence star of two solar luminosities with a foreground extinction similar to what is derived for the X-ray source and an X-ray-to-bolometric luminosity ratio log LX/log Lbol ≃ −2.8. However, the positional offset, the crowdedness of the field, and the lack of excess emission at near- and mid-infrared wavelengths raise doubts both on the identification between the X-ray and infrared sources, and on the nature of the former, including its actual relationship with M 17.
Deeper, higher resolution narrow-band imaging and higher resolution spectroscopy of the structures described here covering a broader range of wavelength would be very useful for completing this investigation, and perhaps obtaining a comprehensive picture of the evolution of the jet since the event that gave rise to the arc and to the more recent activity that has produced the knots. Due to the distance to M 17, the determination of proper motions in the jet, which is a valuable tool in the study of jets in nearby star-forming regions, may still require well over one decade before rendering meaningful results. In the meantime, an important task will be to confirm (or not) the X-ray source CXOU J182100.5-161213 as the driver of the jet.
IRAF is distributed by NOAO, which is operated by the Association of Universities for Research in Astronomy, Inc., under contract to the National Science Foundation.
We have corrected the original value log LX(erg s-1) = 30.53 given by Broos et al. (2007) for the distance to M 17 adopted in the present study, 2.1 kpc, which differs from the 1.6 kpc adopted by those authors.
Acknowledgments
We are pleased to express our thanks to the staffs at the Observatorio del Teide and the ESO La Silla Observatory for the excellent support provided during our observing runs at the IAC80 telescope and at the NTT, respectively. We are very grateful to Dr. John Bally for his constructive referee report and his useful suggestions for improving this paper. We also thank Dr. Bo Reipurth for a critical assessment of the significance of our early imaging results.
References
- Andrews, S. M., Reipurth, B., Bally, J., & Heathcote, S. R. 2004, ApJ, 606, 353 [NASA ADS] [CrossRef] [Google Scholar]
- Bally, J. 2007, ApSS, 311, 15 [Google Scholar]
- Bally, J. 2009, in Protostellar Jets in Context, eds. K. Tsinganos, T. Ray, & M. Stute, ApSS Proc. Ser. (Springer Verlag) [Google Scholar]
- Bally, J., & Reipurth, B. 2001, ApJ, 546, 299 [NASA ADS] [CrossRef] [Google Scholar]
- Bally, J., & Reipurth, B. 2003, AJ, 126, 893 [NASA ADS] [CrossRef] [Google Scholar]
- Bally, J., Johnstone, D., Joncas, G., Reipurth, B., & Mallén-Ornelas, G. 2001, AJ, 122, 1508 [NASA ADS] [CrossRef] [Google Scholar]
- Barbá, R. H., & Arias, J. I. 2007, A&A, 471, 841 [NASA ADS] [CrossRef] [EDP Sciences] [Google Scholar]
- Barrado, D., Stelzer, B., Morales-Calderón, M., et al. 2011, A&A, 526, 21 [Google Scholar]
- Broos, P. S., Feigelson, E. D., Townsley, L. K., et al. 2007, ApJS, 169, 353 [NASA ADS] [CrossRef] [Google Scholar]
- Chen, Z., Jiang, Z., Wang, Y., et al. 2012, PASJ, 64, 110 [NASA ADS] [Google Scholar]
- Chini, R., & Hoffmeister, V. 2008, in Handbook of Star Forming Regions, 2, ed. B. Reipurth, ASP Monographs [Google Scholar]
- Chini, R., Hoffmeister, V., Kimeswenger, S., et al. 2004, Nature, 429, 155 [NASA ADS] [CrossRef] [PubMed] [Google Scholar]
- Churchwell, E., Babler, B. L., Meade, M., et al. 2009, PASP, 121, 213 [NASA ADS] [CrossRef] [Google Scholar]
- Comerón, F., & Fernández, M. 2011, A&A, 528, A99 [NASA ADS] [CrossRef] [EDP Sciences] [Google Scholar]
- D’Antona, F., & Mazzitelli, I. 1994, ApJS, 90, 467 [NASA ADS] [CrossRef] [Google Scholar]
- Esteban, C., Peimbert, M., Torres-Peimbert, S., & García-Rojas, J. 1999, RMxAA, 35, 65 [Google Scholar]
- Feigelson, E. D., & Montmerle, T. 1999, ARA&A, 37, 363 [NASA ADS] [CrossRef] [Google Scholar]
- García-Rojas, J., Esteban, C., Peimbert, A., et al. 2007, RMxAA, 43, 3 [NASA ADS] [Google Scholar]
- Hamuy, M., Walker, A. R., Suntzeff, N. B., et al. 1992, PASP, 104, 533 [NASA ADS] [CrossRef] [Google Scholar]
- Hanson, M. M., Howarth, I. D., & Conti, P. S. 1997, ApJ, 489, 698 [NASA ADS] [CrossRef] [Google Scholar]
- Hoffmeister, V. H., Chini, R., Scheyda, C. M., et al. 2008, ApJ, 686, 310 [NASA ADS] [CrossRef] [Google Scholar]
- Nürnberger, D. E. A., Chini, R., Eisenhauer, F., et al. 2007, A&A, 465, 931 [NASA ADS] [CrossRef] [EDP Sciences] [Google Scholar]
- Osterbrock, D. E. 1989, Astrophysics of Galactic Nebulae and Active Galactic Nuclei (University Science Books) [Google Scholar]
- Raga, A. C., Noriega-Crespo, A., Rodríguez-González, A., et al. 2012, ApJ, 748, 103 [NASA ADS] [CrossRef] [Google Scholar]
- Ray, T., Dougados, C., Bacciotti, F., Eislöffel, J., & Chrysostomou, A. 2007, in Protostars and Planets V, eds. B. Reipurth, D. Jewitt, & K. Keil (University of Arizona Press) [Google Scholar]
- Reipurth, B., & Bally, J. 2001, ARA&A, 39, 403 [NASA ADS] [CrossRef] [Google Scholar]
- Reipurth, B., Bally, J., Fese, R. A., & Devine, D. 1998, Nature, 396, 343 [NASA ADS] [CrossRef] [Google Scholar]
- Reipurth, B., Mikkola, S., Connelley, M., & Valtonen, M. 2010, ApJ, 725, L56 [NASA ADS] [CrossRef] [Google Scholar]
- Robitaille, T. P., Whitney, B. A., Indebetouw, R., & Wood, K. 2007, ApJS, 169, 328 [NASA ADS] [CrossRef] [Google Scholar]
- Schneider, P. C., Günther, H. M., & Schmitt, J. H. M. M. 2011, A&A, 530, A123 [NASA ADS] [CrossRef] [EDP Sciences] [Google Scholar]
- Schwartz, R. D. 1983, ARA&A, 21, 209 [NASA ADS] [CrossRef] [Google Scholar]
- Smith, N., Bally, J., & Walborn, N. 2010, MNRAS, 405, 1153 [NASA ADS] [Google Scholar]
- Stasińska, G. 1982, A&AS, 48, 299 [NASA ADS] [Google Scholar]
- Townsley, L. K., Feigelson, E. D., Montmerle, T., et al. 2003, ApJ, 593, 874 [NASA ADS] [CrossRef] [Google Scholar]
- Yusef-Zadeh, F., Biretta, J., & Wardle, M. 2005, ApJ, 624, 246 [NASA ADS] [CrossRef] [Google Scholar]
All Tables
All Figures
|
Fig. 1 Left: composite of the M 17 mosaic obtained with the IAC80 telescope. In the color figure reproduced in the electronic version of the journal, blue corresponds to emission in the [OIII] filter, green in the Hα filter, and red in the [SII] filter. The area covered is , with north to the top and east to the left. The yellow square indicates the area enlarged in the panels on the right, which contains the structures described in this paper, including three emission knots near the upper right corner and the bright arc-shaped nebula near the bottom left. For reference, an image in the narrow-band continuum adjacent to Hα is included at the bottom right showing stellar sources in the field. Both the knots and the arc are best seen in Fig. 2. |
| In the text | |
|
Fig. 2 R-band image obtained with the NTT of the knots and the arc, aligned in the horizontal direction parallel to the position of the slit in our spectroscopic observations. The position given by Broos et al. (2007) for the X-ray source CXOU J182100.5-161213, which is a candidate jet-driving source, is shown. CXOU J182100.5-161213 is the only X-ray source detected in the entire field. |
| In the text | |
|
Fig. 3 Spectra of the three knots and the arc-like feature, as well as of a representative point in the nebula located roughly half way between knot C and the arc, showing the enhanced [NII] and [SII] emission with respect to Hα in the knots and the arc as compared to the surrounding nebula. The weak [OI] emission line in the spectrum of nebula is almost entirely of telluric origin |
| In the text | |
Current usage metrics show cumulative count of Article Views (full-text article views including HTML views, PDF and ePub downloads, according to the available data) and Abstracts Views on Vision4Press platform.
Data correspond to usage on the plateform after 2015. The current usage metrics is available 48-96 hours after online publication and is updated daily on week days.
Initial download of the metrics may take a while.