Fig. 5
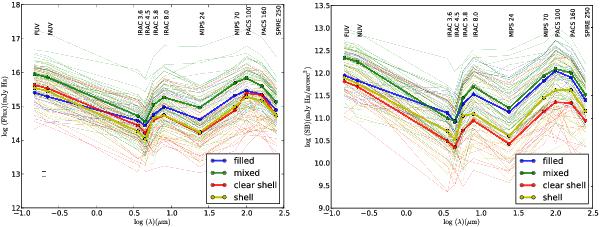
SED for our set of H ii regions. Left panel: SEDs derived using the fluxes of the regions, a median value for the fluxes uncertainties is shown in the lower left corner. Right panel: surface brightness is used to obtain the SEDs. The thick lines correspond to the SEDs obtained using the median values at each band for all the H ii regions in each morphological sample.
Current usage metrics show cumulative count of Article Views (full-text article views including HTML views, PDF and ePub downloads, according to the available data) and Abstracts Views on Vision4Press platform.
Data correspond to usage on the plateform after 2015. The current usage metrics is available 48-96 hours after online publication and is updated daily on week days.
Initial download of the metrics may take a while.