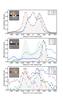
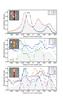
Fig. A.1

Emission line profiles for H ii region 87 classified as clear shell in the horizontal (left) and vertical (right) directions. For clarity, the profiles are separated into three panels (top: Hα, FUV, NUV; middle: 3.6 μm, 4.5 μm, 5.8 μm, 8.0 μm; bottom: 24 μm, 70 μm, 100 μm, 160 μm, 250 μm). The small box in top left corner in each panel shows the location of the profile overlaid on the region, the images correspond to Hα, 4.5 μm, and 250 μm for the top, middle, and bottom panels, respectively. All the profiles are normalised to their maxima. The Hα profile is depicted in grey in all the panels for reference.
Current usage metrics show cumulative count of Article Views (full-text article views including HTML views, PDF and ePub downloads, according to the available data) and Abstracts Views on Vision4Press platform.
Data correspond to usage on the plateform after 2015. The current usage metrics is available 48-96 hours after online publication and is updated daily on week days.
Initial download of the metrics may take a while.