Fig. 9
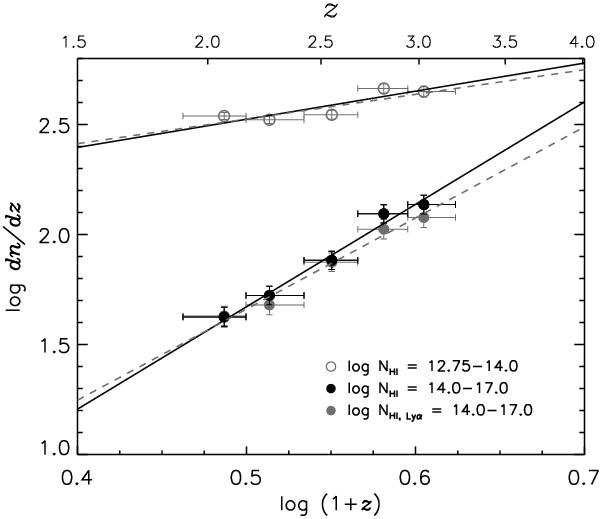
Mean line number density evolution of the combined sample as a function of redshift using the high-order Lyman-series sample for column density intervals of log NH i = [12.75,14.0] and log NH i = [14,17]. The sample is binned in redshift with Δz = 0.26, starting from z = 1.90. The vertical error bars indicate 1σ Poisson errors, while the x-axis error bars show the redshift range covered by each data point. For comparison, the results of the Lyα-only fits (grey open circles) are shown for the log NH i = [14,17] interval. The straight solid lines denote results from a linear regression to the binned data. Two dashed lines represent the mean number density evolution of the Lyα-only fit sample for log NH i = [14,17] (log dn/dz = (−0.41 ± 0.35) + (4.14 ± 0.63) × log (1 + z)) and for log NH i = [12.75,14] (log dn/dz = (1.96 ± 0.13) + (1.12 ± 0.24) × log (1 + z)), respectively. Exactly same redshift range was used for both fit samples. The data are tabulated in Table A.2. The parameters of the fits are given in Table 2.
Current usage metrics show cumulative count of Article Views (full-text article views including HTML views, PDF and ePub downloads, according to the available data) and Abstracts Views on Vision4Press platform.
Data correspond to usage on the plateform after 2015. The current usage metrics is available 48-96 hours after online publication and is updated daily on week days.
Initial download of the metrics may take a while.