Fig. 8
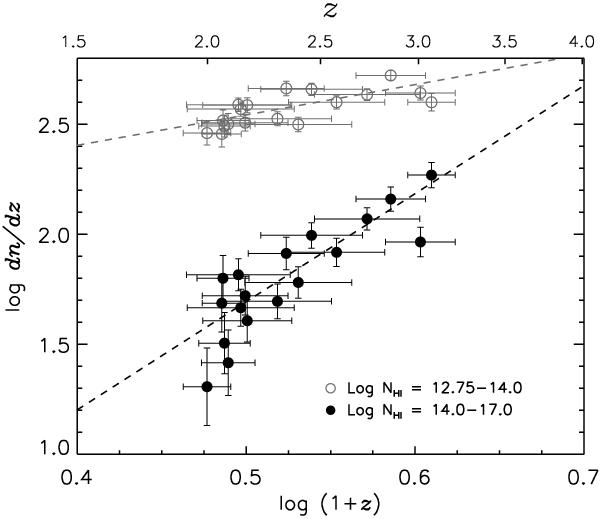
Line number density evolution derived on a quasar by quasar analysis using the high-order Lyman sample for column density intervals of log NH i = [12.75,14.0] and log NH i = [14,17]. The vertical error bars indicate 1σ Poisson errors, while the x-axis error bars show the redshift range covered by each sightline. The straight lines denote results from a linear regression to the data with parameters given in Table 2. The data are tabulated in Table A.1.
Current usage metrics show cumulative count of Article Views (full-text article views including HTML views, PDF and ePub downloads, according to the available data) and Abstracts Views on Vision4Press platform.
Data correspond to usage on the plateform after 2015. The current usage metrics is available 48-96 hours after online publication and is updated daily on week days.
Initial download of the metrics may take a while.