Fig. 4
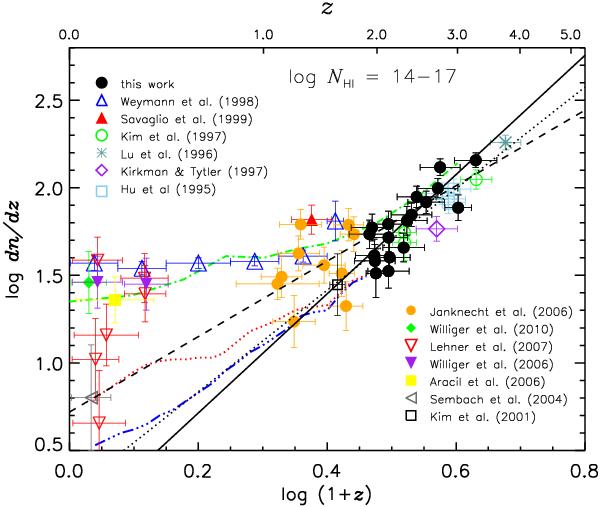
Number density evolution of the Lyα forest in the column density range log NH i = [14,17] of the Lyα-only fits. Black filled circles show results from our data set, which is tabulated in Table A.1. Other data points indicate various results obtained from the literature. The vertical error bars give the 1σ Poisson error, while the x-axis error bars show the redshift range covered by each sightline. The solid line shows the fit to our data only. Dashed line is the result including the literature data for z > 1 (log (1 + z) > 0.3). The dotted line gives the fit given in Kim et al. (2002). The green dot-dashed curve shows the predicted dn/dz evolution based on a quasar-only UV background by Davé et al. (1999). The red dotted and the blue dot-dot-dot-dashed curves at z < 2 illustrate the predicted dn/dz based on momentum-driven wind and no-wind models with a UV background by quasars and galaxies, respectively (Davé et al. 2010).
Current usage metrics show cumulative count of Article Views (full-text article views including HTML views, PDF and ePub downloads, according to the available data) and Abstracts Views on Vision4Press platform.
Data correspond to usage on the plateform after 2015. The current usage metrics is available 48-96 hours after online publication and is updated daily on week days.
Initial download of the metrics may take a while.