Fig. 16
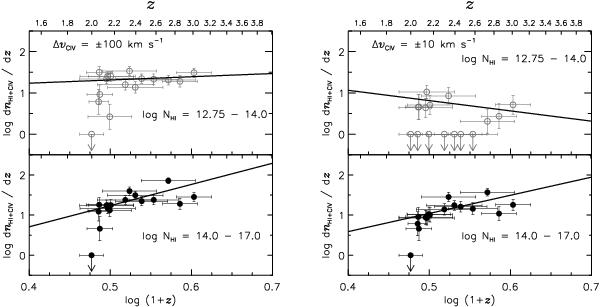
Quasar by quasar line number density evolution of C iv-enriched H i absorbers. The left panels are derived from the ΔvC iv = ±100 km s-1 sample, while the right panels represent the ΔvC iv = ±10 km s-1 one. The open circles in the upper panel represent C iv-enriched absorbers having log NH i = [12.75,14.0] and the filled circles in the lower panel represent log NH i = [14,17]. The vertical error bars mark 1σ Poisson errors, while the x-axis error bars show the redshift range covered by each sightline. Sightlines having no C iv-enriched H i absorbers for a given velocity range are plotted at log ddnC iv/ddz = 0. The solid lines represent linear regressions to the data, using the parameters summarised in Table 4. Sightlines with no C iv-enriched absorbers, log dnH i + C iv/dz is plotted to be 0 with a downward arrow.
Current usage metrics show cumulative count of Article Views (full-text article views including HTML views, PDF and ePub downloads, according to the available data) and Abstracts Views on Vision4Press platform.
Data correspond to usage on the plateform after 2015. The current usage metrics is available 48-96 hours after online publication and is updated daily on week days.
Initial download of the metrics may take a while.