Fig. 2
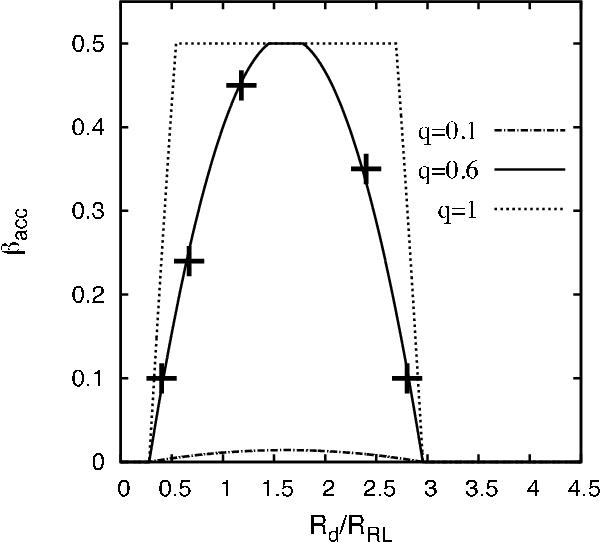
Models of the wind accretion efficiency βacc for different values of q calculated with Eq. (9). The solid line is for q = 0.6, the mass ratio used by Mohamed (2010). The dot-dashed and dotted lines show the resulting efficiency for q = 0.1 and q = 1, respectively. Plus signs are the results of hydrodynamical simulations by Mohamed (2010) listed in Table 1.
Current usage metrics show cumulative count of Article Views (full-text article views including HTML views, PDF and ePub downloads, according to the available data) and Abstracts Views on Vision4Press platform.
Data correspond to usage on the plateform after 2015. The current usage metrics is available 48-96 hours after online publication and is updated daily on week days.
Initial download of the metrics may take a while.