Fig. 4
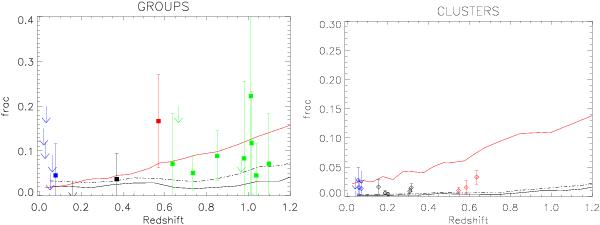
Left panel: fraction of AGN with LH > 1042 erg s-1 in groups and small clusters with velocity dispersion 350 < σ < 700 km s-1. Green symbols are structures from the present work, blue symbols are from Arnold et al. (2009), black symbols from Martini et al. (2009), the red symbol from Eastman et al. (2007). Right panel: the same for clusters with σ > 700 km s-1. In both plots, to determine the upper limits and to estimate the uncertainties on the fractions we used the low number statistics estimators (at 1σ) by Gehrels (1986). The red solid lines are the predictions from the Millenium simulation (Guo et al. 2011), the black solid and dash-dotted lines are the nominal and maximal predictions using the Menci et al. (2006) model, see text for more details.
Current usage metrics show cumulative count of Article Views (full-text article views including HTML views, PDF and ePub downloads, according to the available data) and Abstracts Views on Vision4Press platform.
Data correspond to usage on the plateform after 2015. The current usage metrics is available 48-96 hours after online publication and is updated daily on week days.
Initial download of the metrics may take a while.