Fig. 2
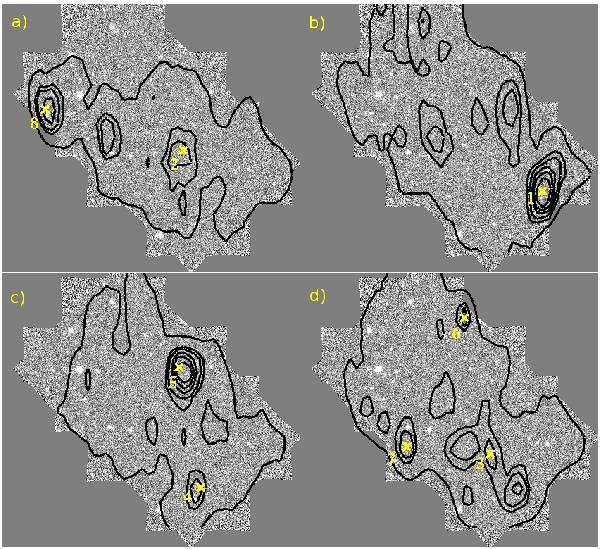
Density isosurfaces for structures at z ~ 0.45−0.48 a); at z ~ 0.64 b); z ~ 0.85 c); and at z ~ 0.97−1.01 d) (average, average +2σ, average +3σ, average +10σ) superimposed on the ACS z850 band image of the GOODS-North field. Yellow crosses indicate the density peak of each structure, and the number is the ID of the structure in Table 1.
Current usage metrics show cumulative count of Article Views (full-text article views including HTML views, PDF and ePub downloads, according to the available data) and Abstracts Views on Vision4Press platform.
Data correspond to usage on the plateform after 2015. The current usage metrics is available 48-96 hours after online publication and is updated daily on week days.
Initial download of the metrics may take a while.