Fig. 7
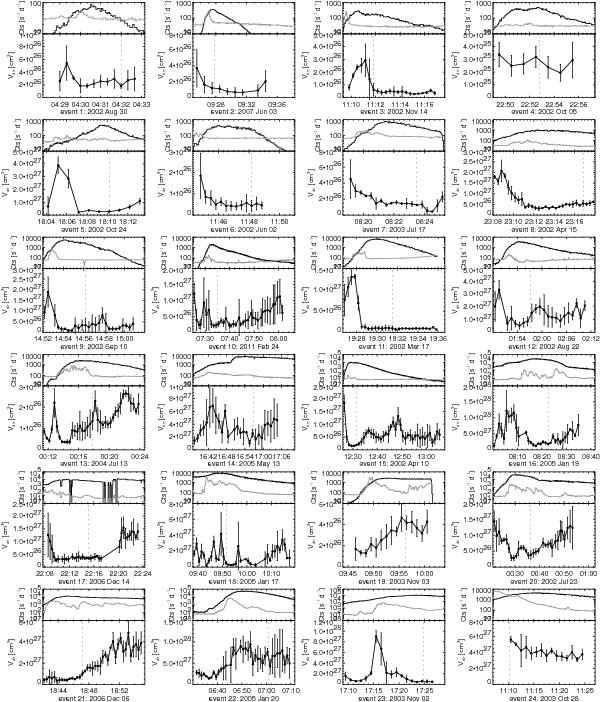
Temporal evolution of the thermal source volume Vdir for all 24 flares. For comparison, the upper parts of the individual plots show the HXR lightcurves in the 6−12 keV (thermal; black line) and the 50−100 keV channels (nonthermal; gray line), respectively, in units of counts per second and detector. The dashed lines denote the time of the GOES SXR peak flux in the 1−8 Å band.
Current usage metrics show cumulative count of Article Views (full-text article views including HTML views, PDF and ePub downloads, according to the available data) and Abstracts Views on Vision4Press platform.
Data correspond to usage on the plateform after 2015. The current usage metrics is available 48-96 hours after online publication and is updated daily on week days.
Initial download of the metrics may take a while.