Fig. 6
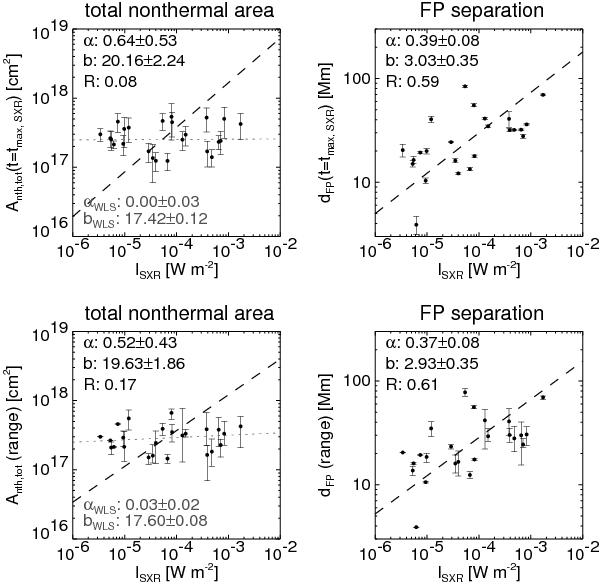
As in Fig. 5, but showing the total nonthermal footpoint areas Anth,tot (left column) and the footpoint separation dFP (right column) as a function of peak GOES soft X-ray flux ISXR. The upper row shows Anth,tot and dFP at the time of the GOES SXR peak, while the lower row depicts the mean values of the volumes, with the error bars showing the whole range from minimum to maximum. For Anth,tot, we additionally show power-law fits obtained with the WLS method (gray dotted line).
Current usage metrics show cumulative count of Article Views (full-text article views including HTML views, PDF and ePub downloads, according to the available data) and Abstracts Views on Vision4Press platform.
Data correspond to usage on the plateform after 2015. The current usage metrics is available 48-96 hours after online publication and is updated daily on week days.
Initial download of the metrics may take a while.