Fig. 5
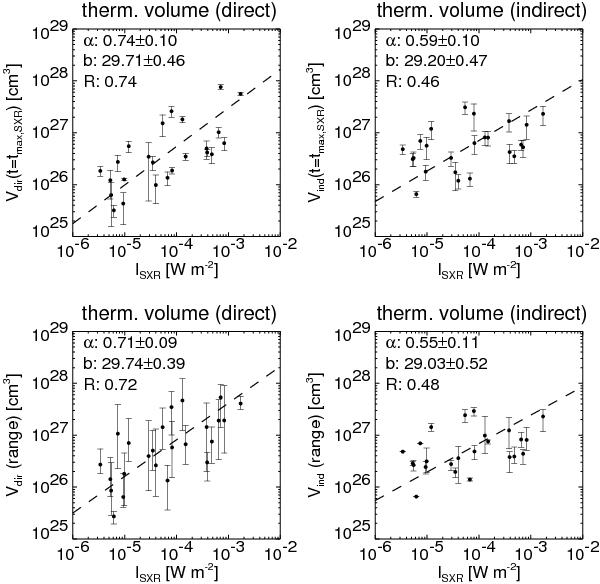
Thermal coronal source volumes derived with the direct (Vdir; left column) and indirect method (Vind; right column) as a function of peak GOES soft X-ray flux ISXR (i.e., GOES class; ISXR = 10-6 W m-2 is a C1 flare, while ISXR = 10-4 W m-2 represents an X1 flare) for the 24 flares analyzed. The upper row shows the volumes at the time of the GOES X-ray peak (t = tmax,SXR), while the lower row depicts the mean values of the volumes, with the error bars showing the whole range from minimum to maximum. Also shown are power-law fits using the BCES bisector method (dashed lines), the slope α and intercept b of the obtained power law, and the rank correlation coefficient, R.
Current usage metrics show cumulative count of Article Views (full-text article views including HTML views, PDF and ePub downloads, according to the available data) and Abstracts Views on Vision4Press platform.
Data correspond to usage on the plateform after 2015. The current usage metrics is available 48-96 hours after online publication and is updated daily on week days.
Initial download of the metrics may take a while.