Fig. 5
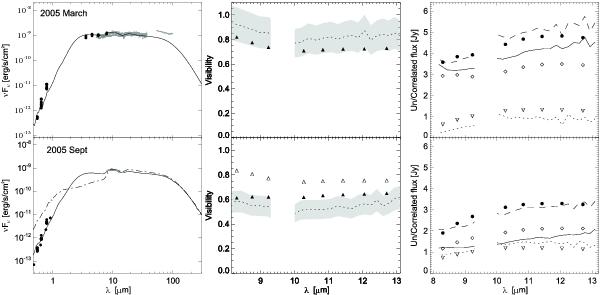
Our models for the 2005 March and September epochs are shown in the top and bottom row. The SEDs and the calibrated visibilities are shown in the left and middle columns. Model visibilities were calculated at eight different wavelengths. In the bottom left panel the solid line, in the bottom middle panel the open triangles show the model where only the accretion rate was decreased relative to the reference model. This model fits the SED quite well, but not the visibilities. The dash-dotted line (bottom left panel) and the filled triangles (bottom middle panel) show the model where the inner radius of the envelope was also increased. As an alternative interpretation of the mid-infrared fits, the observed mid-infrared total, correlated and uncorrelated MIDI spectra (dashed, solid and dotted lines, respectively) and the corresponding model values (filled circles, diamonds and downward pointing open triangles, respectively) are shown in the right column. The lower right panel refers to the case where the inner radius of the envelope increased well beyond the dust sublimation radius, inducing larger changes in visibilities than the ones described earlier. Rin,disk was kept unchanged. Data probably affected by the atmospheric ozone layer are not shown.
Current usage metrics show cumulative count of Article Views (full-text article views including HTML views, PDF and ePub downloads, according to the available data) and Abstracts Views on Vision4Press platform.
Data correspond to usage on the plateform after 2015. The current usage metrics is available 48-96 hours after online publication and is updated daily on week days.
Initial download of the metrics may take a while.