Fig. 3
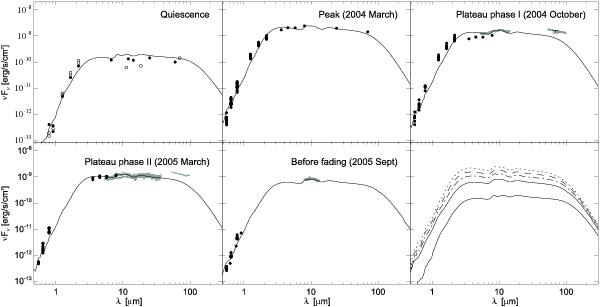
Spectral energy distributions of V1647 Ori at five different epochs. Because of the short timescale variability at the optical and near-infared wavelengths, we present photometry from between 2004-02-01 and 2004-04-30 (2004 March), 2004-10-01 and 2004-10-31 (2004 October), 2005-02-01 and 2005-04-30 (2005 March) and 2005-09-03 and 2005-10-03 (2005 September) in these figures. Our models to the SEDs, where the inner radius of the dust disk is set to 0.5 AU in quiescence and 0.7 AU in all outburst epochs, are overplotted with solid lines (see Sect. 4). Between the outburst epochs only the accretion rate was changed here. Note that the model for 2005 September shown here does not fit the MIDI data (see Fig. 5 and Sect. 4.4). The last panel shows all models. The decrease of the brightness of the object with time, from peak (top) to quiescence (bottom) is continuous. References: quiescence − Ábrahám et al. (2004), Paper I, Aspin et al. (2008); peak (2004 March) − AP07, McGehee et al. (2004), Muzerolle et al. (2005); plateau phase I (2004 October) − AP07, this work, Quanz et al. (2007); plateau phase II (2005 March) − AP07, this work, Quanz et al. (2007); before the rapid fading (2005 September) − Aspin & Reipurth (2009), this work.
Current usage metrics show cumulative count of Article Views (full-text article views including HTML views, PDF and ePub downloads, according to the available data) and Abstracts Views on Vision4Press platform.
Data correspond to usage on the plateform after 2015. The current usage metrics is available 48-96 hours after online publication and is updated daily on week days.
Initial download of the metrics may take a while.