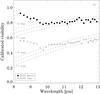
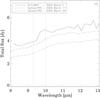
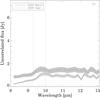
Fig. 2
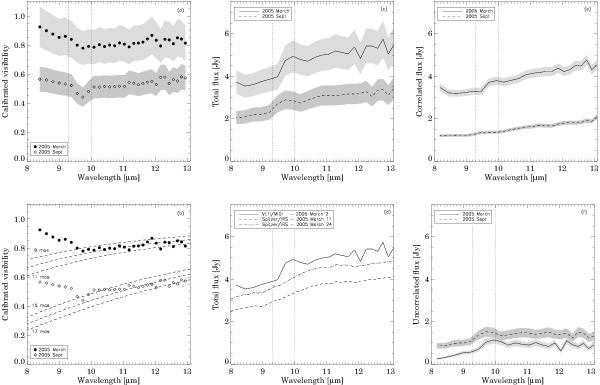
Calibrated visibilities a) and Gaussian size estimates b). MIDI spectra are shown in panel c). The MIDI and Spitzer/IRS spectra from 2005 March are compared in panel d). The errors of the Spitzer spectra (~10%) are not shown for the sake of clarity. Correlated spectra (i.e., inner disk spectra, panel e)) and uncorrelated spectra (i.e., outer disk spectra, panel f)) of V1647 Ori are also shown at two epochs. The baselines of the two observations are very similar, so the MIDI data of the two epochs can be compared. The shaded areas mark the errors in the panels a), c), e), f)). The vertical dotted lines show the ozone band that could affect the ground-based observations.
Current usage metrics show cumulative count of Article Views (full-text article views including HTML views, PDF and ePub downloads, according to the available data) and Abstracts Views on Vision4Press platform.
Data correspond to usage on the plateform after 2015. The current usage metrics is available 48-96 hours after online publication and is updated daily on week days.
Initial download of the metrics may take a while.