Fig. 1
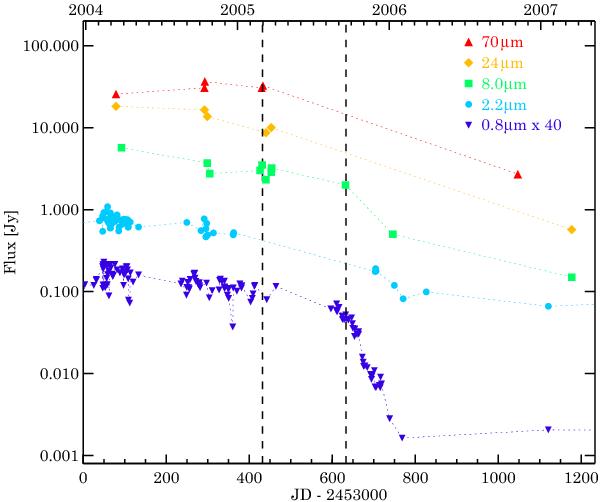
Light curves of V1647 Ori. The vertical dashed lines denote the epochs of the MIDI observations. IC (0.8 μm) and Ks (2.2 μm) band data are from AP07 and this paper. The IC data are scaled up by a factor of 40 for the sake of better plotting. 8.0 μm data are from Muzerolle et al. (2005), Paper I, Quanz et al. (2007), this paper (obtained from MIDI acqusition data), and Aspin et al. (2008, extrapolated from their N′ band data). 24 μm data are from this paper and Aspin et al. (2008) (extrapolated from their Qa band data). 70 μm data are from this paper.
Current usage metrics show cumulative count of Article Views (full-text article views including HTML views, PDF and ePub downloads, according to the available data) and Abstracts Views on Vision4Press platform.
Data correspond to usage on the plateform after 2015. The current usage metrics is available 48-96 hours after online publication and is updated daily on week days.
Initial download of the metrics may take a while.