Fig. 8
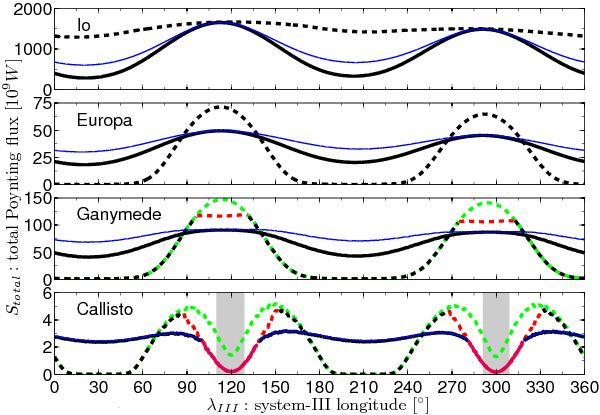
Total Poynting flux generated by the Galilean satellites as a function of system
III longitude for different models of the plasma density and interaction strength.
Solid lines display the Poynting flux with magnetospheric density models after Bagenal & Delamere (2011) calculated with
two different assumptions of the interaction strength
 controled by κ = 1 (thin blue) and κ = 2 (thick
black). The dashed line displays the Poynting flux for individual magnetospheric
plasma models, where the dashed black lines are calculated with the full expression
given in (53), while the dashed
green and the dashed red lines represent upper and lower limits when condition
(56) is met. The grey area shows
cases where the interaction is expected to be super-Alfvénic, i.e.
MA > 1. More details see
explanations in the main text. Results are discussed for each satellite individually
in Sects. 3.1.1 to 3.1.4.
controled by κ = 1 (thin blue) and κ = 2 (thick
black). The dashed line displays the Poynting flux for individual magnetospheric
plasma models, where the dashed black lines are calculated with the full expression
given in (53), while the dashed
green and the dashed red lines represent upper and lower limits when condition
(56) is met. The grey area shows
cases where the interaction is expected to be super-Alfvénic, i.e.
MA > 1. More details see
explanations in the main text. Results are discussed for each satellite individually
in Sects. 3.1.1 to 3.1.4.
Current usage metrics show cumulative count of Article Views (full-text article views including HTML views, PDF and ePub downloads, according to the available data) and Abstracts Views on Vision4Press platform.
Data correspond to usage on the plateform after 2015. The current usage metrics is available 48-96 hours after online publication and is updated daily on week days.
Initial download of the metrics may take a while.