Free Access
Fig. 3
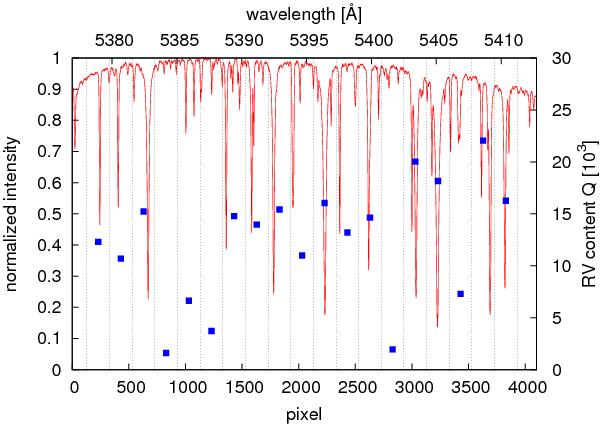
A VLC spectrum of τ Cet (without iodine cell) and the arrangement of the 200 pixel chunks with their individual Q-factors (blue squares). The intensity maximum of the spectrum is set to unity. The intensity declines to the edges due to instrumental effects (Blaze function).
Current usage metrics show cumulative count of Article Views (full-text article views including HTML views, PDF and ePub downloads, according to the available data) and Abstracts Views on Vision4Press platform.
Data correspond to usage on the plateform after 2015. The current usage metrics is available 48-96 hours after online publication and is updated daily on week days.
Initial download of the metrics may take a while.