Fig. 19
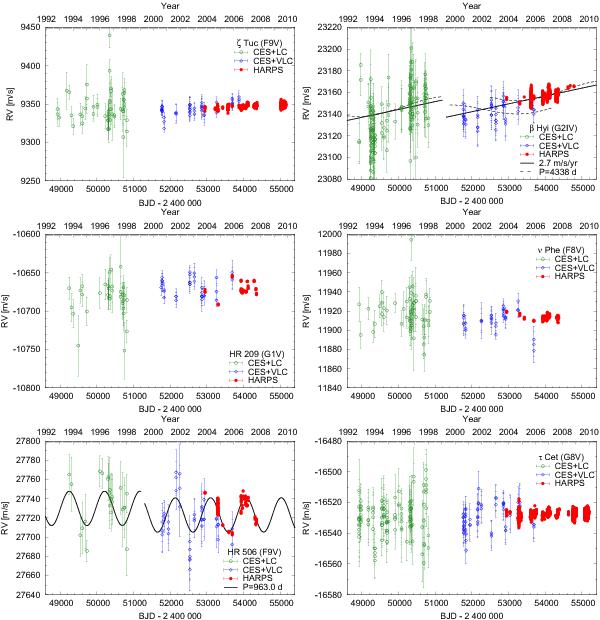
Radial velocity time series (unbinned data). The error bars depict the internal measurement errors ΔRVi, i.e. not including jitter. LC (green open circles) and VLC (blue open diamonds) data are displayed with their measured offsets. Jumps in the curves indicates the difference between the measured (Sect. 3.5) and fitted (Sect. 4) LC-VLC offset. HARPS data are in red filled circles. The solid lines indicate significant models, while dashed lines illustrate less or non-significant alternative models. All models include secular acceleration. Model curves are shown for β Hyi (trend and long-period sinusoid, see text for discussion), and HR 506 (sinusoid).
Current usage metrics show cumulative count of Article Views (full-text article views including HTML views, PDF and ePub downloads, according to the available data) and Abstracts Views on Vision4Press platform.
Data correspond to usage on the plateform after 2015. The current usage metrics is available 48-96 hours after online publication and is updated daily on week days.
Initial download of the metrics may take a while.