| Issue |
A&A
Volume 551, March 2013
|
|
|---|---|---|
| Article Number | L14 | |
| Number of page(s) | 4 | |
| Section | Letters | |
| DOI | https://doi.org/10.1051/0004-6361/201321255 | |
| Published online | 11 March 2013 | |
Independent confirmation of β Pictoris b imaging with NICI⋆
1 LESIA, Observatoire de Paris, CNRS, University Pierre et Marie Curie Paris 6 and University Denis Diderot Paris 7, 5 place Jules Janssen, 92195 Meudon, France
e-mail: This email address is being protected from spambots. You need JavaScript enabled to view it.
2 Institut de Planétologie et d’Astrophysique de Grenoble, Université Joseph Fourier, CNRS, BP 53, 38041 Grenoble, France
3 Max Planck Institute for Astronomy, Königstuhl 17, 69117 Heidelberg, Germany
Received: 7 February 2013
Accepted: 21 February 2013
Abstract
Context. Ever since it was identified with VLT/NaCo as a bona-fide exoplanet with a mass of about 9 times that of Jupiter at an orbital separation of 8–9 AU, β Pictoris b has been one of the most studied objects nowadays. The link between the planet and the dusty disk is unambiguously confirmed, and this system provides an opportunity to study the disk/planet interactions and to constrain formation and evolutionary models of giant gas planets. Still, β Pictoris b has never been confirmed with other telescopes so far.
Aims. We aimed at an independent confirmation using a different instrument.
Methods. We retrieved archive images from Gemini South obtained with the instrument NICI, which is designed for high-contrast imaging. The observations combine coronagraphy and angular differential imaging and were obtained at three epochs in Nov. 2008, Dec. 2009, and Dec. 2010.
Results. We report the detection with NICI of the planet β Pictoris b in Dec. 2010 images at a separation of 404 ± 10 mas and PA = 212.1 ± 0.7°. It is the first time this planet has been observed with a different telescope than the VLT.
Key words: stars: individual: beta Pictoris / stars: early-type / techniques: image processing / techniques: high angular resolution
Based on data retrieved from the Gemini archive.
© ESO, 2013
1. Introduction
The A-type star β Pictoris has been the subject of much attention since the discovery of a planet orbiting it (Lagrange et al. 2009a). The first observation from the Very Large Telescope in 2003 reported a candidate companion aligned with the debris disk at a separation of ~0.41′′ to the northeast (PA = 34.4°). The candidate planet, undetected in early 2009 (Lagrange et al. 2009b), was finally recovered at ~0.3′′ to the southwest at the end of the same year (Lagrange et al. 2010) definitely confirming its companionship with the star and semi-major axis smaller than 15 AU. Given the assumption on the age of this system (~12 Myr) and its distance (19.44 pc), the candidate planet was attributed a mass of about 9 MJup based on evolutionary models (Baraffe et al. 2003) and later confirmed with more detailed photometric works (Quanz et al. 2010; Bonnefoy et al. 2011; Bonnefoy et al. 2013) and upper limits from radial velocity (Lagrange et al. 2012b). Owing to systematic follow-up observations, the orbit was characterized by Chauvin et al. (2012), who determined a semi-major axis of 8–9 AU with low eccentricity (<0.17). Lagrange et al. (2012a) demonstrate that the planet is inclined with respect to the main disk and therefore likely to be responsible for the observed warp of planetesimals (Mouillet et al. 1997; Heap et al. 2000). Recently, a global analysis of the planet near-IR photometry and careful comparison to models has been presented in Bonnefoy et al. (2013). Moreover, β Pictoris b, the closest planet to its parent star ever imaged so far, may well have been formed via core accretion.
So far, any observations of β Pictoris b reported in the literature has been obtained with Nasmyth Adaptive Optics System (NaCo) and Near-Infrared Imager and Spectrograph, the near-IR AO-assisted camera at the Very Large Telescope (Rousset et al. 2003; Lenzen et al. 2003). A single tentative observation at Keck was presented in Fitzgerald et al. (2009) but was performed at a time when the planet was angularly too close to the star for being detectable and a relatively high airmass. In this paper, we present the first analysis of data collected at Gemini South and retrieved from the Gemini archive.
2. Observations
Log of observations.
The Near Infrared Coronagraphic Imager (NICI, Toomey & Ftaclas 2003), installed at the 8-m telescope, Gemini South, is designed to take advantage of the spectral differential imaging (SDI) for exoplanet detection (Racine et al. 1999). The instrument is based on a near-IR (1–5 μm) dual-band imager in which two images are formed simultaneously (owing to a beam splitter) on two separate detectors. The two spectral channels are composed with the same filters so that it is possible to combine either two spectrally adjacent filters (CH4L with λ = 1.578 μm and CH4S with λ = 1.652 μm) for methanated-object detection or any near IR broad-band filters. The pixel scale is 17.932 and 17.970 mas per pixel (as measured for each detector in Nov. 2010 at an accuracy of 0.1%), hence providing a field of view of about 18.4′′. NICI also allows for angular differential imaging (ADI, Marois et al. 2006) in order to improve the final contrast.
As regards the coronagraphic part, several semi-transparent Lyot masks (radii ranging from 0.22′′ to 0.90′′) are used in combination with several pupil stops undersized with respect to the telescope pupil (outer edge stopped from 80 to 95% that of the pupil). In the following we refer to two coronagraphic configurations that associate the 0.22′′ and 0.32′′ masks to the 95% pupil stop. The focal masks transmit a fraction of the light (~1:300 for the 0.32′′ mask) at the center and have a flat-topped Gaussian profile. The transmission is therefore not uniform in the field near the mask and has to be taken into account when it comes to the photometry of faint companions. Each mask is deposited on a substrate that carries its own imperfections.
Signal-to-noise ratio, magnitude differences in Ks (set 6), and astrometry (ρ, PA), measured at the planet location for several algorithms.
Whereas SDI and ADI were already implemented on large telescopes, NICI is certainly the first instrument fully designed for this specific purpose (Liu et al. 2010) and it has an important role to play in preparing the observations with the upcoming planet finders, such as SPHERE (Beuzit et al. 2008) and GPI (Macintosh et al. 2008).
We retrieved three epochs of observations for β Pictoris from the NICI archive released on Nov. 24, 2012, corresponding to programs GS-2008B-SV-1, GS-2009B-Q-500, and GS-2010B-Q-501. The list of available data is given in Table 1.
Data reduction was performed in a similar way to the NaCo data using our own pipeline (Bonnefoy et al. 2013; Boccaletti et al. 2012), and we followed the guidelines presented in other papers reporting NICI observations (Biller et al. 2010; Wahhaj et al. 2011; Nielsen et al. 2012). Here, the two channels are considered separately. The images are dark-subtracted and flat-fielded. We did not correct for distortion since we are interested in a very small field around the star (the planet is expected at a separation closer than 0.4′′ at these epochs), and we did not attempt to perform SDI processing when the CH4L/CH4S filters were in use. Flat fields are usually not available for the dates of observation so we used calibrations taken several months apart. This prevents having to account for inhomogeneities in the substrate of the focal masks as long as we notice a drift in the mask position by several pixels between the flat fields and the science data. In addition, background was not subtracted since we lack of sky observations.
Unlike NaCo observations of β Pictoris, the data are not saved in data cubes but summed, hence totaling long exposures of 40–60 s. While this is not critical with respect to the field rotation at the separation of the planet, it can be a concern for selecting the best frames. Since the observations were obtained with a semi-transparent focal Lyot mask, the selection is based on the frame with the minimal amount of intensity (integrated over all the pixels) indicative of a better centering or a good AO correction. For a given sequence of frames, we measured the total flux and retained the frames for which the flux is lower than three times the standard deviation of the total flux above the minimal flux. For the data presented hereafter, the selection retained more than 80% of the frames.
We proceeded in two steps to register of the coronagraphic images. First, we applied a rough estimation of the star position with a Gaussian fit of the images that were thresholded typically at a few percent of the maximum flux, as we did in Boccaletti et al. (2012). Then, we performed a more precise determination of the star location with Moffat fitting of the central attenuated spot behind the semi-transparent Lyot mask, which is known to move linearly with the actual star position (Lloyd & Sivaramakrishnan 2005). The coronagraph centering is relatively good in 2008 and 2009 data, but it features a noticeable drift in 2010 data that amounts to several pixels. The 0.22′′ mask is about 12 pixels in radius, for comparison. The parallactic angle is calculated from the azimuth and declination of the telescope pointing contained in the FITS headers.
Out-of-mask unsaturated images of the star used to determine the PSF shape and intensity are not available in the archive. To mimic a point spread function (PSF) we used the central spot behind the mask as proposed in the NICI documentation1. We measured an FWHM of 3.6 pixels equivalent to 64 mas in the Ks band. However, this spot is not a rigorously attenuated copy of the star since the energy in the center results from the addition of the coronagraphic diffraction and the semi-transparent mask transmission. As a result, the photometric information provided by this signal is difficult to calibrate because it depends on the mask centering, the AO correction, the mask size, and the wavelength.
Then, we processed the data with a set of ADI algorithms: cADI, rADI (Marois et al. 2006), LOCI (Lafrenière et al. 2007), and also KLIP, which makes use of a principal component analysis (Soummer et al. 2012). For a brief description of these algorithms and relevant control parameters see Lagrange et al. (2012a); Boccaletti et al. (2012). Several parameters for these algorithms were tested to achieve the best detection performance (separation criteria are indicated in Table 2).
As a result, the data taken in 2008 do not show any hints of β Pictoris b, as expected from NaCo observations (Lagrange et al. 2009b), because the planet is angularly too close to the star about 0.2′′ in projected separation according to the orbit determination in Chauvin et al. (2012). For the 2009 set of data (CH4L/CH4S and H), it is still undetected, since the Lyot mask is too large (r = 0.32′′) with respect to the planet separation (ρ = 0.3′′ in Dec. 2009) and/or the halo is saturated (set 4). We note that it was recovered to the SW of the star in NaCo maskless images for the same epoch (Oct. to Dec. 2009) but at longer wavelengths (Lp filter, 3.8 μm) thanks to a lower brightness ratio (Lagrange et al. 2010). Moreover, the planet is too warm for methane to produce an absorption (T = 1700 K, Bonnefoy et al. 2013) so SDI using CH4L/CH4S filters would not help in detecting it. Finally, the planet β Pictoris b is detected in the Dec. 2010 images (sets 5 and 6) in the Ks band at signal-to-noise ratio S/N = 11 − 15 (measured on a 3-pixel radius aperture with rADI and LOCI), although the individual frames are near the saturation level within 0.35′′ from the mask (for the shortest integration time of 0.76 s). The planet is also seen marginally in the H band (S/N = 5 − 6). Figure 1 presents some images obtained with the rADI and LOCI algorithms for both the Ks and H bands. The results obtained with KLIP are not particularly of good quality (not shown here) and are actually strongly affected by the saturation of the frames near the edges of the mask.
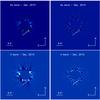 |
Fig. 1 Final images processed with rADI (left) and LOCI (right) for the Ks and H filter (set 6). The arrow points to the planet. The central numerical mask is 0.3′′ in radius, so larger than the coronagraphic mask. The field of view is 3′′ × 3′′. |
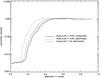 |
Fig. 2 Off-axis transmissions of the mask derived from the 0.32′′ mask profile measured in CH4L (solid line) and estimated for the 0.22′′/CH4L (dotted) and the Ks filter (dashed). |
3. Photometry and astrometry
In this section we focus on the analysis of set 6, which provides the best contrast performance at the location of the planet. The extraction of the planet photometry (and its error bar) is delicate in these data for two reasons, unsaturated PSFs are missing and the focal Lyot mask produces an attenuation on the planet flux.
There is no published or reported calibration for the 0.22′′ mask attenuation profile. But, according to the NICI instrument description, it is expected to be a scaled-down version of the 0.32′′ mask attenuation. We retrieved measurements obtained in CH4L for the 0.32′′ mask transmission as a function of X,Y coordinates. First, we derived the mask center coordinates from this low-resolution profile, averaged the left and right parts, and normalized to the intensity in the 0.5–0.8′′ region where the mask is expected to have no influence. Then, we assumed a proportional scaling with respect to the size of the mask (0.22/0.32), as well as with the wavelength (CH4L/Ks = 2.15/1.652), the mask appearing as if it were smaller at longer wavelengths. The profiles we derived are shown in Fig. 2. Assuming the separation was 390 ± 10 mas (Chauvin et al. 2012) in Dec. 2010, we measured that the radial attenuation reaches 0.80 ± 0.02 at the location of β Pictoris b. As for the central attenuation of a point source, is no longer scalable to other wavelengths or mask sizes because of the diffraction by the coronagraphic mask. Instead, to measure this central attenuation, we used a binary star observed in Ks in and out of the 0.22′′ mask (same object as in Biller et al. 2010) and found a value of 120 ± 5. We retained this calibration to derive the planet photometry, and we note that this number is very different from the attenuation given in the NICI documentation (about 300). In addition, it also depends on the star centering and AO correction, which are not necessarily identical when observing the target star. Such variations make the use of the central coronagraphic spot a poor photometric calibrator. Overall, the uncertainties on the determination of the mask radial transmission and central attenuation contributes at a level of 8–10%, so 0.14 mag, hence comparable to the estimation of 11% by Biller et al. (2010) for PZ Tel b with the same mask/filter configuration (PZ Tel b being at about the same separation as β Pictoris b).
To extract the photometry of the planet, we proceeded in the same way as in Bonnefoy et al. (2013) so that it is directly comparable to the values derived with NaCo. Fake planets (attenuated copy of the PSF) were injected at the same radius as the planet (~0.4′′) but with different PAs so that the speckle noise is averaged. We considered seven positive fake planets (FPPOS) equally separated by 45° and one negative fake planet (FPNEG) superimposed with β Pictoris b. We measured the average intensity ratio between positive fake planets and the true planet (RPOS), as well as the residual intensity at the true planet location when using a negative fake planet (RNEG). As we scanned the fake planet to star brightness ratio from 2 × 10⁻⁵ to 2 × 10⁻⁴, we searched for both the value of RPOS closer to unity and the minimum value of RNEG. The method was repeated for several rADI and LOCI reductions, and the measured brightness ratios are reported in Table 2, together with the S/N. As regards determining uncertainties, in addition to the errors introduced by the imperfect knowledge of the mask transmission (0.14 mag), we also took the observed PSF photometric variations (0.23 mag) into account, as well as the dispersion of our measurements (0.12 mag for rADI/FPPOS, 0.21 mag for rADI/FPNEG, 0.12 mag for LOCI/FPPOS, and 0.29 mag for LOCI/FPNEG). To be conservative, the errors were added linearly amounting to the final error bars indicated in Table 2.
Therefore, the derived magnitude differences of Table 2 only marginally agree with respect to those measured with NaCo (ΔmKs = 9.2 ± 0.2). While this is compatible within the error bars, we attribute the discrepancy to 1/ the lack of an unocculted, unsaturated PSF for the target star; and 2/ the saturation of the coronagraphic halo near the position of the planet.
In what concerns the astrometry, we assumed the star position is determined by the central attenuated spot behind the coronagraphic mask, and we performed Moffat fitting in a small five-pixel radius aperture centered on the guessed planet location. The obtained values (Table 2): ρ = 404 ± 10 mas and PA = 212.1 ± 0.7° on average, are in perfect agreement with those found by Chauvin et al. (2012) in Nov. 2010 (390 ± 10 mas, PA = 212.34 ± 2.13°), so one month earlier than the present data. The true north position is known to an accuracy better than 0.1° (included in our error bar) according to the NICI documentation.
4. Conclusion
The NICI data released on Nov. 24, 2012 allowed us to recover the planet β Pictoris b at 404 ± 10 mas from the star in the southwest direction from the Dec. 2010 data. It is the first time β Pictoris b has been detected unambiguously with a telescope and an instrument that is different than the discovery instrument NaCo. Although the presence of the planet is already confirmed from NaCo observations, owing to careful follow-up, the present result provides an healthy independent confirmation and demonstrates the importance of archiving high-contrast imaging data as
already shown for the HR 8799 planets (Lafrenière et al. 2009; Soummer et al. 2011; Currie et al. 2012). The astrometry of the companion conforms with NaCo observations; however, we note that the lack of a true PSF of β Pic prevents us from accurately comparing the photometry to previous estimations from NaCo. More observations with NICI are desirable to collect additional photometric measurements and then to further explore the atmosphere of this planet. With the upcoming next generation of planet finders and the hopefully large number of planetary mass companion detection, it will be mandatory to perform multitelescope observations for independent confirmations.
Acknowledgments
We would like to thank the anonymous referee for providing relevant comments that helped us improve this letter.
References
- Baraffe, I., Chabrier, G., Barman, T. S., Allard, F., & Hauschildt, P. H. 2003, A&A, 402, 701 [NASA ADS] [CrossRef] [EDP Sciences] [Google Scholar]
- Beuzit, J.-L., Feldt, M., Dohlen, K., et al. 2008, in SPIE Conf. Ser., 7014 [Google Scholar]
- Biller, B. A., Liu, M. C., Wahhaj, Z., et al. 2010, ApJ, 720, L82 [NASA ADS] [CrossRef] [Google Scholar]
- Boccaletti, A., Augereau, J. C., Lagrange, A. M., et al. 2012, A&A, 544, A85 [NASA ADS] [CrossRef] [EDP Sciences] [Google Scholar]
- Bonnefoy, M., Lagrange, A. M., Boccaletti, A., et al. 2011, A&A, 528, L15 [NASA ADS] [CrossRef] [EDP Sciences] [Google Scholar]
- Bonnefoy, M., Boccaletti, A., Lagrange, A.-M., et al. 2013, A&A, accepted [arXiv:1302.1160] [Google Scholar]
- Chauvin, G., Lagrange, A. M., Beust, H., et al. 2012, A&A, 542, A41 [NASA ADS] [CrossRef] [EDP Sciences] [Google Scholar]
- Currie, T., Fukagawa, M., Thalmann, C., Matsumura, S., & Plavchan, P. 2012, ApJ, 755, L34 [NASA ADS] [CrossRef] [Google Scholar]
- Fitzgerald, M. P., Kalas, P. G., & Graham, J. R. 2009, ApJ, 706, L41 [NASA ADS] [CrossRef] [Google Scholar]
- Heap, S. R., Lindler, D. J., Lanz, T. M., et al. 2000, ApJ, 539, 435 [Google Scholar]
- Lafrenière, D., Marois, C., Doyon, R., & Barman, T. 2009, ApJ, 694, L148 [NASA ADS] [CrossRef] [Google Scholar]
- Lafrenière, D., Marois, C., Doyon, R., Nadeau, D., & Artigau, É. 2007, ApJ, 660, 770 [NASA ADS] [CrossRef] [Google Scholar]
- Lagrange, A. M., Gratadour, D., Chauvin, G., et al. 2009a, A&A, 493, L21 [NASA ADS] [CrossRef] [EDP Sciences] [Google Scholar]
- Lagrange, A. M., Kasper, M., Boccaletti, A., et al. 2009b, A&A, 506, 927 [NASA ADS] [CrossRef] [EDP Sciences] [Google Scholar]
- Lagrange, A.-M., Bonnefoy, M., Chauvin, G., et al. 2010, Science, 329, 57 [NASA ADS] [CrossRef] [PubMed] [Google Scholar]
- Lagrange, A.-M., Boccaletti, A., Milli, J., et al. 2012a, A&A, 542, A40 [NASA ADS] [CrossRef] [EDP Sciences] [Google Scholar]
- Lagrange, A. M., De Bondt, K., Meunier, N., et al. 2012b, A&A, 542, A18 [NASA ADS] [CrossRef] [EDP Sciences] [Google Scholar]
- Lenzen, R., Hartung, M., Brandner, W., et al. 2003, in SPIE Conf. Ser. 4841, eds. M. Iye, & A. F. M. Moorwood, 944 [Google Scholar]
- Liu, M. C., Wahhaj, Z., Biller, B. A., et al. 2010, Adaptive Optics Systems II, eds. B. L. Ellerbroek, M. Hart, N. Hubin, & P. L. Wizinowich, Proc. SPIE, 7736, 53 [Google Scholar]
- Lloyd, J. P., & Sivaramakrishnan, A. 2005, ApJ, 621, 1153 [NASA ADS] [CrossRef] [Google Scholar]
- Macintosh, B. A., Graham, J. R., Palmer, D. W., et al. 2008, in SPIE Conf. Ser., 7015 [Google Scholar]
- Marois, C., Lafrenière, D., Doyon, R., Macintosh, B., & Nadeau, D. 2006, ApJ, 641, 556 [Google Scholar]
- Mouillet, D., Larwood, J. D., Papaloizou, J. C. B., & Lagrange, A. M. 1997, MNRAS, 292, 896 [NASA ADS] [CrossRef] [PubMed] [Google Scholar]
- Nielsen, E. L., Liu, M. C., Wahhaj, Z., et al. 2012, ApJ, 750, 53 [Google Scholar]
- Quanz, S. P., Meyer, M. R., Kenworthy, M. A., et al. 2010, ApJ, 722, L49 [NASA ADS] [CrossRef] [Google Scholar]
- Racine, R., Walker, G. A. H., Nadeau, D., Doyon, R., & Marois, C. 1999, PASP, 111, 587 [NASA ADS] [CrossRef] [Google Scholar]
- Rousset, G., Lacombe, F., Puget, P., et al. 2003, in SPIE Conf. Ser. 4839, eds. P. L. Wizinowich, & D. Bonaccini, 140 [Google Scholar]
- Soummer, R., Brendan Hagan, J., Pueyo, L., et al. 2011, ApJ, 741, 55 [NASA ADS] [CrossRef] [Google Scholar]
- Soummer, R., Pueyo, L., & Larkin, J. 2012, ApJ, 755, L28 [NASA ADS] [CrossRef] [Google Scholar]
- Toomey, D. W., & Ftaclas, C. 2003, Instrument Design and Performance for Optical/Infrared Ground-based Telescopes, eds. M. Iye, A. F. M. Moorwood, Proc SPIE, 4841, 889 [Google Scholar]
- Wahhaj, Z., Liu, M. C., Biller, B. A., et al. 2011, ApJ, 729, 139 [NASA ADS] [CrossRef] [Google Scholar]
All Tables
Signal-to-noise ratio, magnitude differences in Ks (set 6), and astrometry (ρ, PA), measured at the planet location for several algorithms.
All Figures
|
Fig. 1 Final images processed with rADI (left) and LOCI (right) for the Ks and H filter (set 6). The arrow points to the planet. The central numerical mask is 0.3′′ in radius, so larger than the coronagraphic mask. The field of view is 3′′ × 3′′. |
| In the text | |
|
Fig. 2 Off-axis transmissions of the mask derived from the 0.32′′ mask profile measured in CH4L (solid line) and estimated for the 0.22′′/CH4L (dotted) and the Ks filter (dashed). |
| In the text | |
Current usage metrics show cumulative count of Article Views (full-text article views including HTML views, PDF and ePub downloads, according to the available data) and Abstracts Views on Vision4Press platform.
Data correspond to usage on the plateform after 2015. The current usage metrics is available 48-96 hours after online publication and is updated daily on week days.
Initial download of the metrics may take a while.