Fig. 11
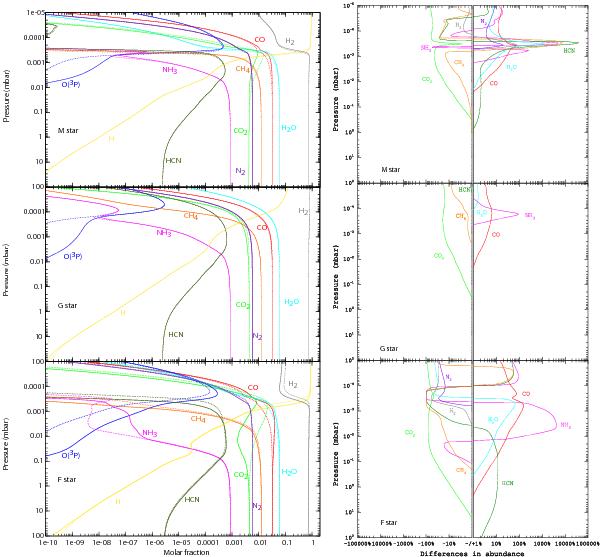
Left: comparison of the atmospheric composition of GJ 436b using σCO2(300 K) (dotted line) and σCO2(550 K) (full line) when the planet orbits an M star (top), a G star (middle) and an F star (bottom). Right: differences in abundances (in %) between the results obtained with σCO2(300 K) and σCO2(550 K) for species that have an abundance superior to 10-10, for an M star (top), a G star (middle), and an F star (bottom).
Current usage metrics show cumulative count of Article Views (full-text article views including HTML views, PDF and ePub downloads, according to the available data) and Abstracts Views on Vision4Press platform.
Data correspond to usage on the plateform after 2015. The current usage metrics is available 48-96 hours after online publication and is updated daily on week days.
Initial download of the metrics may take a while.