Fig. 3
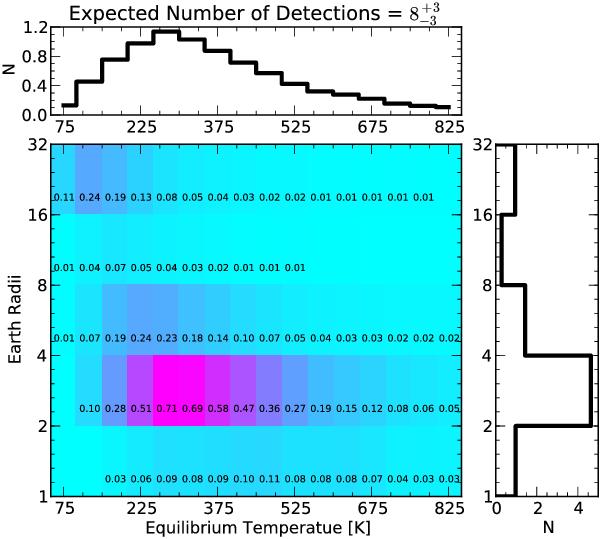
Predicted number of planets (as a function of RP and Teq) expected to be characterized in the baseline high-contrast GSMT observing scenario outlined in Sect. 3.1. The colors and the small numbers in each cell both indicate the expectation value for that combination of RP and Teq, and the histograms show the marginalized distributions. Note that the baseline scenario simulated here conservatively assumes that planets in the two smallest RP ranges occur with equal frequency (see Sects. 2.2 and 3.2).
Current usage metrics show cumulative count of Article Views (full-text article views including HTML views, PDF and ePub downloads, according to the available data) and Abstracts Views on Vision4Press platform.
Data correspond to usage on the plateform after 2015. The current usage metrics is available 48-96 hours after online publication and is updated daily on week days.
Initial download of the metrics may take a while.