Fig. 1
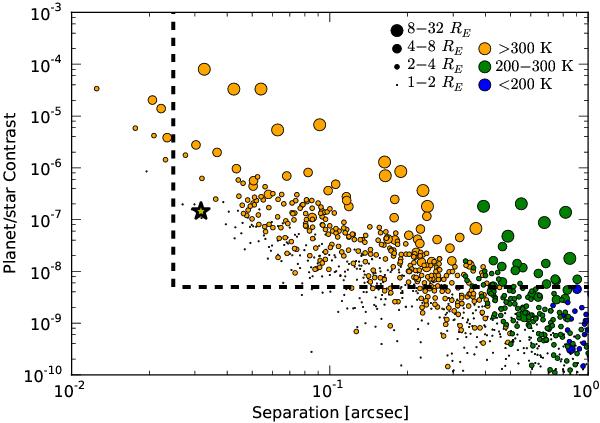
Simulated planet populations for α Cen B in the baseline scenario outlined in Sect. 3.1, observing at 1.2 μm with an instrument similar to TMT/PFI or TMT/SEIT. Planets above and to the right of the dashed line would be accessible to high-contrast spectroscopic characterization. The star symbol indicates α Cen Bb (assuming a radius of 1.1 R⊕). Each circle’s size and color refers to a simulated planet’s RP and Teq, as indicated in the legend. Most of the simulated planets shown are detected in scattered starlight, though thermal emission contributes to the shortest-period planets (including α Cen Bb).
Current usage metrics show cumulative count of Article Views (full-text article views including HTML views, PDF and ePub downloads, according to the available data) and Abstracts Views on Vision4Press platform.
Data correspond to usage on the plateform after 2015. The current usage metrics is available 48-96 hours after online publication and is updated daily on week days.
Initial download of the metrics may take a while.