Fig. 3
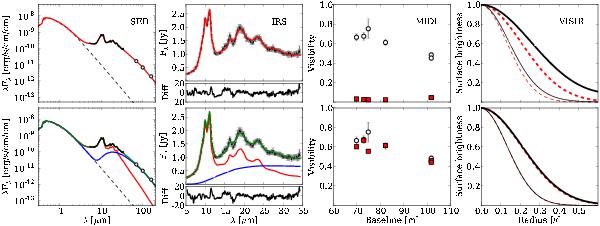
Upper and lower panels: results for the 1B and 2B models. Left panel: SED of HD 113766 A. The IRS spectrum is in black, PACS data are shown as black open circles. For the 1B model, the final best fit is in red. For the 2B model, the final total fit is in green, the separate contributions of the inner and outer belts are in red and blue, respectively. Middle left panel: blow-up of the stellar subtracted IRS spectrum. Color coding is the same as for the left panel. Residuals (100 × [ Fν,obs − Fν,mod ] /Fν,obs) are displayed below the spectra. Middle right panel: observed and modeled MIDI visibilities as a function of the baseline (open black circles and red squares, respectively, with 1σ uncertainties). Right panel: modeled surface brightness at 10 and 20 μm (thin and thick black lines, respectively) of synthetic images convoled with 2D Gaussian with FWHM of 0.322 and 0.498′′. The 2D Gaussian with the aforementioned FWHM, assumed to be PSF representative of the images, are shown in thin and thick dashed red lines for comparison.
Current usage metrics show cumulative count of Article Views (full-text article views including HTML views, PDF and ePub downloads, according to the available data) and Abstracts Views on Vision4Press platform.
Data correspond to usage on the plateform after 2015. The current usage metrics is available 48-96 hours after online publication and is updated daily on week days.
Initial download of the metrics may take a while.