Fig. 10
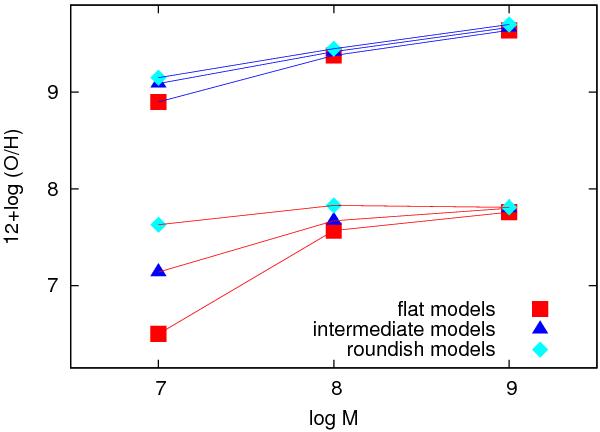
Oxygen abundances (in number) after 500 Myr of evolution for “H” models as a function of initial baryonic mass. Symbols are as in Fig. 9. The abundances in the cold (T < 2 × 10⁴ K) phase are shown in the lower set of points (connected by red lines). The abundances in the hot (T > 2 × 10⁴ K) phase are shown in the upper set of points (connected by blue lines).
Current usage metrics show cumulative count of Article Views (full-text article views including HTML views, PDF and ePub downloads, according to the available data) and Abstracts Views on Vision4Press platform.
Data correspond to usage on the plateform after 2015. The current usage metrics is available 48-96 hours after online publication and is updated daily on week days.
Initial download of the metrics may take a while.