Fig. 7
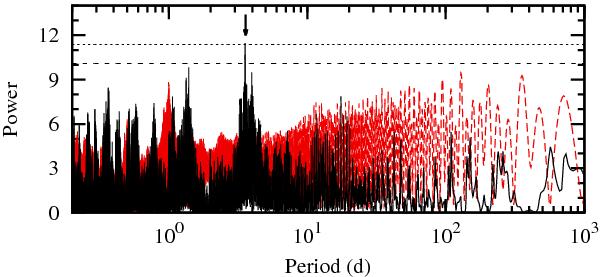
Periodogram of RV residuals for WASP-12 b on a Keplerian orbit (continuous black line) and the spectral window (dashed red line, multiplied by 10 for clarity). The arrow indicates the strongest peak at 3.58 d that is not associated with significant power in the spectral window. The shortest period is set by the radius of the star. The dashed and dotted horizontal lines show empirical FAP levels of 1% and 0.1%, respectively.
Current usage metrics show cumulative count of Article Views (full-text article views including HTML views, PDF and ePub downloads, according to the available data) and Abstracts Views on Vision4Press platform.
Data correspond to usage on the plateform after 2015. The current usage metrics is available 48-96 hours after online publication and is updated daily on week days.
Initial download of the metrics may take a while.