Fig. 6
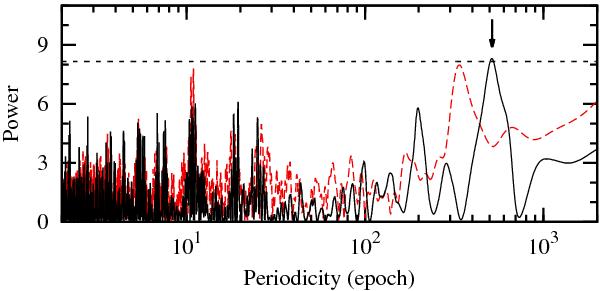
Periodogram of the O–C residuals (continuous black line) and spectral window (dashed red line, multiplied by 10 for clarity). The dashed vertical line shows the empirical FAP level of 1%. The arrow marks the most significant peak, which as can be clearly seen, is not caused by the structure of gaps in the time domain. The shortest period investigated is given by the Nyquist frequency.
Current usage metrics show cumulative count of Article Views (full-text article views including HTML views, PDF and ePub downloads, according to the available data) and Abstracts Views on Vision4Press platform.
Data correspond to usage on the plateform after 2015. The current usage metrics is available 48-96 hours after online publication and is updated daily on week days.
Initial download of the metrics may take a while.