Fig. 5
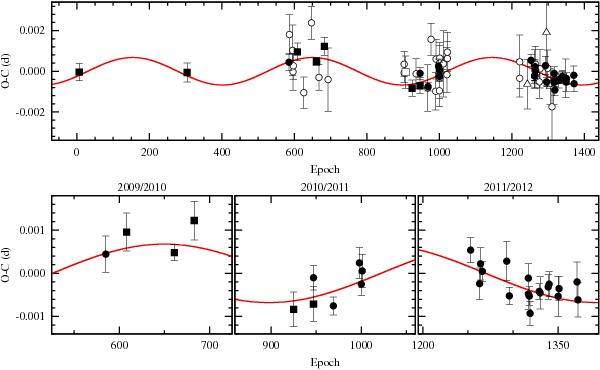
O–C diagram for WASP-12 b’s transit timing. The filled circles denote our observations and squares the literature ones with errors smaller than 40 s. The open symbols – circles and squares for our and literature data, respectively – mark points with timing errors greater than 40 s. The open triangles denote the amateur times included in this work. The postulated sinusoidal variation is sketched with a red line. Individual observing seasons, covered by our high-precision observations, are zoomed-in at the bottom. The literature data are taken from Hebb et al. (2009), Chan et al. (2011), Maciejewski et al. (2011), Sada et al. (2012), and Cowan et al. (2012).
Current usage metrics show cumulative count of Article Views (full-text article views including HTML views, PDF and ePub downloads, according to the available data) and Abstracts Views on Vision4Press platform.
Data correspond to usage on the plateform after 2015. The current usage metrics is available 48-96 hours after online publication and is updated daily on week days.
Initial download of the metrics may take a while.