Fig. 5
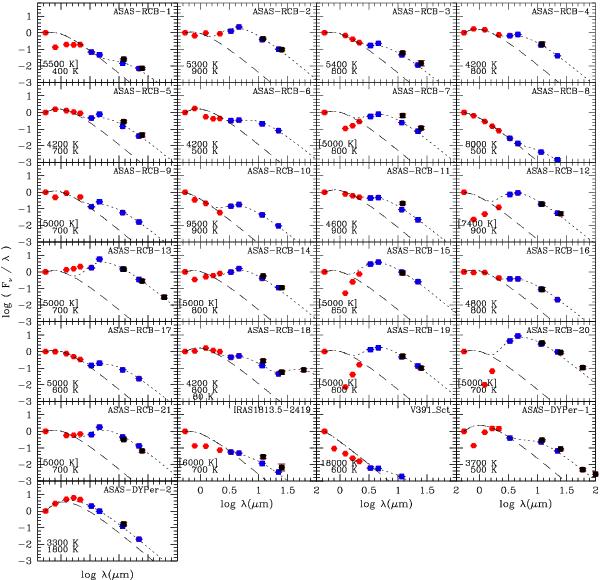
Best attempts to reconstruct the spectral energy distribution of the 23 new RCB stars and the 2 new DY Pers. This task was made difficult by high interstellar extinction and because the series of optical and infrared measurements were not taken at the same time and therefore not at the same brightness phase (decline or maximum?). See Sect. 7 for more details. The red dots represent the extinction-corrected optical and infrared measurements: the maximum V magnitude as observed on the ASAS light curve (Table 4), the DENIS I measurement and the infrared 2MASS J, H and K or the DENIS J and K magnitudes. The blue and black dots correspond to the WISE and IRAS measurements. The blackbody of the photosphere is represented with dashed lines, while the dotted lines represent the best fit found with one or two circumstellar shells added. The temperatures of these simple blackbodies are listed for each star (top: photosphere, bottom: shell). If the photospheric temperature is indicated between square brackets, the related blackbody was added only for representation because there are no convincing measurements to constrain the fit.
Current usage metrics show cumulative count of Article Views (full-text article views including HTML views, PDF and ePub downloads, according to the available data) and Abstracts Views on Vision4Press platform.
Data correspond to usage on the plateform after 2015. The current usage metrics is available 48-96 hours after online publication and is updated daily on week days.
Initial download of the metrics may take a while.