Free Access
Fig. 4
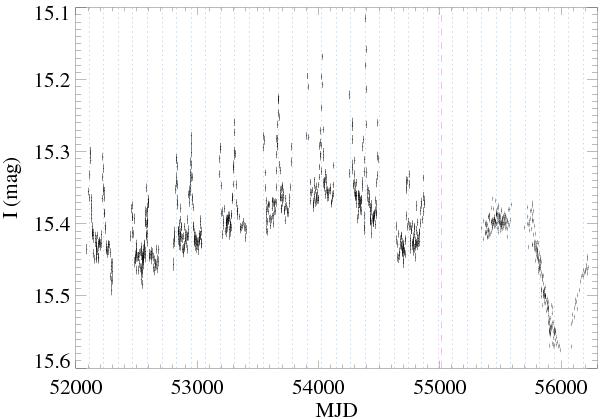
Optical I-band light curve of RX J0123.4-7321 from OGLE III (before MJD 55 000) and OGLE IV (after MJD 55 000). Predicted outburst maxima are indicated by the dotted blue lines. The time of the XMM-Newton observation is marked by the dashed red line.
Current usage metrics show cumulative count of Article Views (full-text article views including HTML views, PDF and ePub downloads, according to the available data) and Abstracts Views on Vision4Press platform.
Data correspond to usage on the plateform after 2015. The current usage metrics is available 48-96 hours after online publication and is updated daily on week days.
Initial download of the metrics may take a while.