Fig. 17
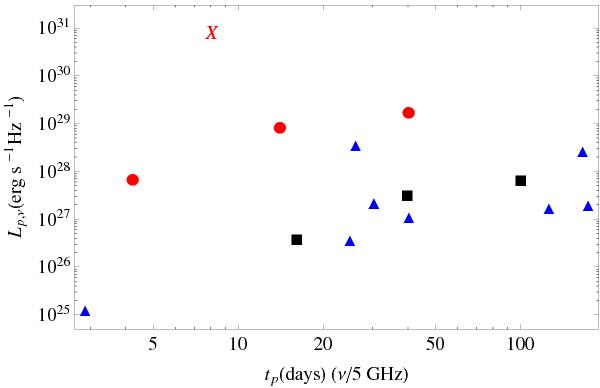
Plot of the peak spectral radio Luminosity per unit frequency versus the time at which the peak occurs, for different SN associated to GRBs. The circles represent the SN emission associated to SN 2006aj (GRB 060218), SN 1998bw (GRB 980425) and SN 2003lw (GRB 031203). The triangles represent the SN Ib/c for which there are radio observations, namely SN 2002ap, SN 1990B, SN 2008D, SN 1994I, SN 2009bb and SN 2003L. The squares represent the SN IIb: SN 2008ax, SN 2001ig, SN 1993J, SN 2001gd and SN 2003bg. The red cross is the luminosity related to GRB 110709B afterglow. It is higher than the emissions of the other SN, considered “standard”.
Current usage metrics show cumulative count of Article Views (full-text article views including HTML views, PDF and ePub downloads, according to the available data) and Abstracts Views on Vision4Press platform.
Data correspond to usage on the plateform after 2015. The current usage metrics is available 48-96 hours after online publication and is updated daily on week days.
Initial download of the metrics may take a while.