Free Access
Fig. 10
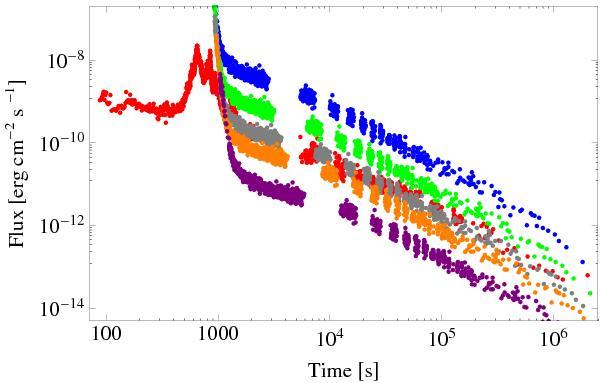
Plot of GRB 090618 seen as if it were at different redshifts: 0.2 (blue), 0.4 (green), 0.7 (gray), 1.0 (orange), and 2.0 (purple). The red light curve corresponds to GRB 110709B. We can see that it lies between the green and the orange light curves, indicating that the redshift must be between 0.4 and 1.0.
Current usage metrics show cumulative count of Article Views (full-text article views including HTML views, PDF and ePub downloads, according to the available data) and Abstracts Views on Vision4Press platform.
Data correspond to usage on the plateform after 2015. The current usage metrics is available 48-96 hours after online publication and is updated daily on week days.
Initial download of the metrics may take a while.