Fig. 1
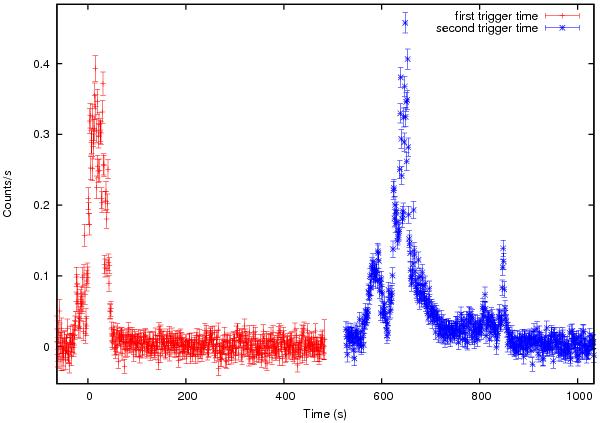
BAT light curve of GRB 110709B, including the two trigger times. Here we can appreciate the time separation (about 10 min) between the first and the second trigger. The light curve is in the (15–150 keV) energy band. The time is relative to the first trigger time, of 331 939 966 s (in MET seconds). The second trigger time was at 331 940 612 s in MET seconds.
Current usage metrics show cumulative count of Article Views (full-text article views including HTML views, PDF and ePub downloads, according to the available data) and Abstracts Views on Vision4Press platform.
Data correspond to usage on the plateform after 2015. The current usage metrics is available 48-96 hours after online publication and is updated daily on week days.
Initial download of the metrics may take a while.