| Issue |
A&A
Volume 551, March 2013
|
|
|---|---|---|
| Article Number | A141 | |
| Number of page(s) | 11 | |
| Section | Extragalactic astronomy | |
| DOI | https://doi.org/10.1051/0004-6361/201220667 | |
| Published online | 11 March 2013 | |
153 MHz GMRT follow-up of steep-spectrum diffuse emission in galaxy clusters
1 Laboratoire Lagrange, UMR7293, Université de Nice Sophia-Antipolis, CNRS, Observatoire de la Côte d’Azur, 06300 Nice, France
e-mail: This email address is being protected from spambots. You need JavaScript enabled to view it.
2 INAF – Istituto di Radioastronomia, via Gobetti 101, 40129 Bologna, Italy
3 National Radio Astronomy Observatory, 520 Edgemont Road, Charlottesville, VA 22903-2475, USA
4 Dipartimento di Astronomia, Universitá di Bologna, via Ranzani 1, 40127 Bologna, Italy
5 Department of Astronomy, University of Maryland, College Park, MD 20742-2421, USA
6 Joint Space-Science Institute, University of Maryland, College Park, MD, 20742-2421, USA
7 National Centre for Radio Astrophysics, TIFR, Ganeshkhind, 411007 Pune, India
8 Indian Institute of Science Education and Research, Sutarwadi Road, Pashan, 411021 Pune, India
Received: 30 October 2012
Accepted: 3 February 2013
Abstract
Aims. We present new high-sensitivity 153 MHz Giant Meterwave Radio Telescope follow-up observations of the diffuse steep-spectrum cluster radio sources in the galaxy clusters Abell 521, Abell 697, and Abell 1682. Abell 521 hosts a relic, and together with Abell 697 it also hosts a giant very steep-spectrum radio halo. Abell 1682 is a more complex system with candidate steep spectrum diffuse emission.
Methods. We imaged the diffuse radio emission in these clusters at 153 MHz, and provided flux density measurements of all sources at this frequency. Our new flux density measurements, coupled with the existing data at higher frequencies, allowed us to study the total spectrum of the halos and relic over at least one order of magnitude in frequency.
Results. Our images confirm the very steep “diffuse component” in Abell 1682. We found that the spectrum of the relic in Abell 521 can be fitted by a single power-law with α = 1.45 ± 0.02 from 153 MHz to 5 GHz. Moreover, we confirm that the halos in Abell 521 and Abell 697 have a very steep spectrum , with α = 1.8 − 1.9 and α = 1.52 ± 0.05, respectively. Even including of the 153 MHz flux density information, it is impossible to distinguish between power-law and curved spectra, as derived from homogeneous turbulent re-acceleration. The latter are favoured on the basis of simple energetic arguments, and we expect that LOFAR will finally unveil the spectral shape of radio halos below 100 MHz, thus providing clues on their origin.
Key words: radiation mechanisms: non-thermal / galaxies: clusters: general / galaxies: clusters: individual: A 521 / galaxies: clusters: individual: A 697 / galaxies: clusters: individual: A1682
Jansky Fellow of the National Radio Astronomy Observatory.
© ESO, 2013
1. Introduction
Clusters of galaxies are the largest and most massive gravitationally bound systems in the Universe, with a typical total mass content of up to a few 1015 M⊙ in the form of galaxies, hot intra-cluster medium (ICM) and dark matter in order of increasing fraction.
The existence of non-thermal components (cosmic rays and magnetic fields) on the cluster scale permeating the ICM is nowadays well established thanks to deep radio observations. These show diffuse extended (up to and above Mpc) radio synchrotron sources with no obvious optical counterpart in ~50 massive galaxy clusters. According to their morphology and polarization properties, diffuse Mpc-scale radio sources are classified as halos or relics (e.g. Ferrari et al. 2008; Venturi 2011, for recent reviews). They probe ~μG large-scale magnetic fields and relativistic (~GeV) electrons in the ICM.
Radio halos and relics share some observational properties: they both have steep synchrotron spectra, with typical spectral index values α ~ 1.2–1.4 (in the convention S ∝ ν− α), and are characterized by very low surface brightness emission (~μJy/arcsec2). However, they differ in the location within galaxy clusters and in their polarization properties. Halos are centrally located, their size and shape are usually similar to the distribution of the X-ray brightness coming from the intra-cluster gas, and they are unpolarised (the only confirmed exception is MACS J0717+3745, Bonafede et al. 2009). Relics are found in the outskirts of galaxy clusters, in most cases at the border of the X-ray emission from the ICM; they exhibit a variety of shapes and have high fractional polarization.
There is now compelling observational evidence in favour of an unambiguous connection between cluster mergers and the detection of radio halos and/or relics. In particular, a quantitative radio/X-ray analysis of the Giant Metrewave Radio Telescope (GMRT) cluster radio halo sample (Venturi et al. 2007, 2008, hereafter V08), carried out in Cassano et al. 2010 shows that radio halos are always found in clusters with high disturbance, as derived by a number of X-ray morphological indicators, while relaxed systems never host one. A few outliers exist, i.e. dynamically disturbed clusters without detected radio halo at the sensitivity levels of the current instruments. The spectral properties of some radio halos (e.g. Schlickeiser et al. 1987; Thierbach et al. 2003; Brunetti et al. 2008; Donnert et al. 2010) combined with the radio halo-cluster merger connection (Cassano et al. 2010; Brunetti 2007) support a scenario based on turbulent re-acceleration for radio halos, whereby the emitting electrons are re-accelerated by turbulence in the ICM during cluster mergers (Brunetti et al. 2001; Petrosian 2001). An alternative possibility to explain the origin of radio halos is provided by the “secondary model”, where relativistic electrons are the secondary products of inelastic proton-proton collisions in the ICM (e.g. Dennison 1980; Blasi & Colafrancesco 1999).
Complementary, the origin of relics seems to be related to accreting and merger shocks in the outer regions of the clusters, even though a clear connection between relics and shocks has so far been circumstantial (Abell 521, Giacintucci et al. 2008, hereafter G08; Abell 754, Macario et al. 2011; RXC J1314.4–2515, Mazzotta et al. 2011; likely CIZA J2242.8+5301, see Ogrean et al. 2013).
Despite their steep spectra, halos and relics have mainly been imaged at GHz frequencies. Only recently, thanks to the very good imaging capabilities of the GMRT at low frequencies and to the advent of LOw Frequency ARray (LOFAR), it has become possible to perform high-sensitivity observations of halos and relics at sub-GHz frequencies down to 150 MHz and below, thus allowing us to probe the “low end” of the energy distribution of the relativistic electron population (e.g. van Weeren et al. 2011; Kale & Dwarakanath 2009, 2010; van Weeren et al. 2012). This is essential for understanding the origin of these sources, since the acceleration mechanisms at play leave a clear imprint on the particle spectrum (and hence on the radio emission). To date, accurate flux density measurements of radio halos and relics below ν ≲ 300 MHz are known only for a handful of sources, and this field of investigation is still largely unexplored.
The low-frequency follow-up of the GMRT radio halo sample (Venturi et al. 2009, 2013; Giacintucci et al. 2011, hereafter V13) led to the unexpected discovery of a family of radio halos with very steep spectra, i.e. α ~ 1.5 ÷ 2, which are barely visible at GHz frequencies but are clearly detected and imaged at ≲325 MHz. The prototype of this class of sources was found in Abell 521 (Brunetti et al. 2008, hereafter B08; Dallacasa et al. 2009, hereafter D09) Radio halos with ultra-steep spectra are extreme cases of this class of cluster sources. Their very steep spectrum suggests that the re-acceleration mechanisms are inefficient, because the energy of the re-acceleration is concentrated in the lowest energy electrons. At the same time, the very steep spectrum of these sources challenges some of the proposed models for their origin, such as the secondary models, which would require an implausibly high energy budget (Brunetti et al. 2008, B08).
With the aim to investigate the properties of diffuse cluster sources at very low frequency, we performed GMRT observations at 153 MHz of three clusters: Abell 521 and Abell 697, both hosting a very steep spectrum radio halo, (B08; D09; Macario et al. 2010, hereafter M10), and Abell 1682. The latter is characterized by extended radio emission on the cluster scale, which is difficult to fit into the halo/relic classification (V08; Venturi et al. 2011, hereafter V11). The present 153 MHz observations, combined with the radio data already available in the literature, allow us to study the spectra of the diffuse cluster sources in Abell 521 and Abell 697 with five data points in the frequency range 153 MHz–1.4 GHz, and to additionally investigate the nature of the emission in Abell 1682.
The paper is organized as follows: in Sect. 2 we summarize the properties and literature information of the three clusters. In Sect. 3 we present the new GMRT radio observations and data reduction procedure. Radio images are presented in Sect. 4; the data analysis and spectral results are described in Section 5. In Sect. 6 we discuss our results in the light of the current models for the origin of radio halos and relics, with particular attention to their spectral properties at low frequency. A summary and concluding remarks are given in Sect. 7.
Throughout the paper, we adopt a ΛCDM cosmology, with H0 = 70 km s-1 Mpc-1, Ωm = 0.3 and ΩΛ = 0.7. Hereafter, we use the abbreviation “A” for “Abell” clusters.
2. Cluster sample
2.1. A 521: the prototypical USSRH
A 521 is a massive and X-ray luminous merging cluster (MV ~ 1.9 × 10¹⁵ M⊙; LX [0.1 − 2.4 keV] ≃ 8 × 1044 erg s-1), located at redshift z = 0.247 (1′ = 232.2 kpc). Multi-wavelegth studies show that this system is undergoing multiple merging episodes between smaller sub-clusters (e.g. Ferrari et al. 2003). It hosts both a peripheral relic and a central giant radio halo, which have been studied in detail at various frequencies (Ferrari et al. 2006; Giacintucci et al. 2006, G08, B08 and D09).
The relic source is detected up to 5 GHz, and its spectrum in the range 240 MHz–5 GHz is well fitted by a single power-law with spectral index α ≃ 1.5 (G08, B08). It is one of the very few cases where a shock front detected in X-ray is coincident with the relic emission (G08, Bourdin et al. 2013). The central radio halo is barely detected at frequencies ≳610 MHz, and becomes clearly visible only below 330 MHz (G08, B08). Its integrated spectrum is very steep, with α ≃ 1.9 over the range 240 MHz–1.4 GHz (D09 and references therein), therefore it is considered the prototypical USSRH.
2.2. A 697
A 697 is a hot (kT ≃ 10 keV), luminous (LX ≃ 1045 erg s-1) and massive cluster (MV ~ 2.3 × 10¹⁵ M⊙) at z = 0.282 (1′ = 255.6 kpc). Observational evidence suggests that A 697 is in a complex dynamical state, and it is most likely undergoing multiple merger/accretion of small clumps: substructure in the galaxy distribution and in the gas has been detected through optical and X-ray analysis (Girardi et al. 2006; M10).
The giant radio halo in A 697 was clearly detected with the GMRT at 610 MHz, as part of the GMRT radio halo survey observations (V08). In M10, using deep 325 MHz GMRT observations together with the 610 MHz GMRT data and VLA archival data at 1.4 GHz, we showed that the integrated radio spectrum of the halo is very steep, with  .
.
The high-frequency end of the spectrum of the halo was recently constrained by Westerbork Synthesis Radio Telescope (WSRT) observations at 1.4 and 1.7 GHz (van Weeren et al. 2011); the authors fitted the spectrum with a single power-law with  . This value, though slightly flatter, is consistent with our earlier result.
Summary of GMRT 153 MHz observations.
2.3. A 1682: a very complex cluster
A 1682 is an X-ray luminous (LX [0.1−2.4 keV] ≃ 7 × 1044 erg s-1) cluster located at redshift z = 0.2260 (1′ = 237.2 kpc). X-ray and optical observations suggest that the cluster has experienced a recent merger (e.g. Dahle et al. 2002; Morrison et al. 2003).
A 1682 shows a very complex radio morphology at 610 MHz (V08). The radio emission is dominated by an extended tail at the cluster centre (named E-tail) and by two features referred to as S–E and N–W ridge (see Fig. 6 in V08), whose nature is still unclear. Beyond these individual sources, V08 reported positive residuals, hinting at low surface brightness diffuse emission embedded in the emission from the main radio sources and extended on the cluster scale. GMRT follow-up observations at 240 MHz clearly revealed the presence of another feature, named “diffuse component” (V11 & V13). This has a strong counterpart in the VLSS (Very Low frequency Sky Survey, Cohen et al. 2007) image, and has been imaged with the VLA in the A configuration at 74 MHz (see Fig. 1 of V11, left panel; Dallacasa et al., in prep.). Those observations suggest that the diffuse component has a very steep spectrum.
3. Observations and data reduction
In Table 1 we report the main details of the GMRT 153 MHz follow-up observations of our cluster sample. All clusters were observed in August 2009. To achieve high sensitivity and to ensure good u − v coverage, each cluster was observed for a total time of ~10 h. To minimize radio frequency interference (RFI) and scintillation, night-time observations were carried out for all the clusters, except for A 1682, due to scheduling constrains. The day-time observations affected our results significantly, as we discuss below. The observations were recorded in one sideband 8 MHz wide, split into 128 spectral channels of 62.5 kHz each.
The data reduction was performed using the software packages AIPS (e.g., Bridle & Greisen 1994), Obit (Cotton 2008), ParselTongue (Kettenis et al. 2006), and SPAM (Intema et al. 2009). AIPS provided us with the basic functionality needed for the largest part of the data reduction, accessed from the Python programming language using the ParselTongue interface. Obit was used for RFI excision (see below), and SPAM was used to derive and apply direction-dependent calibrations during (AIPS-based) imaging.
For each observation, the flux scale and bandpass shapes were derived from an ~20 min observation on 3C 147, adopting a flux of 60.0 Jy at 153 MHz (for a discussion on calibrator flux scales below 330 MHz, see Intema et al. 2011; see also Scaife & Heald 2012, for a more recent study of low-frequency calibrator spectral models). Furthermore, 3C 147 was used to estimate the instrumental phase contribution to the antenna gains, needed for SPAM ionospheric calibration (for details, see Intema et al. 2009). The bandpass, flux scale, and instrumental phase information were used to correct the target field data, resulting in an effective bandwidth of 6.875 MHz.
Strong RFI and other bad data were removed from the target field data after visual inspection, simple clipping of bad visibility amplitudes, and subtracting persistent RFI (Athreya 2009). As a next step, the data volume was averaged in frequency to 22 channels of 312.5 kHz each to speed up the processing and to avoid significant bandwidth smearing. We phase-calibrated each target field using a ten-component point source model derived from the NRAO VLA Sky Survey (NVSS, Condon et al. 1998) and from the WEsterbork Northern Sky Survey (WENSS, Rengelink et al. 1997), followed by wide-field imaging and cleaning of the full field-of-view with 75 facets. Rounds of self-calibration, wide-field imaging, and inspection of the residual visibility data for subsequent editing were repeated several times, with amplitude calibration in the final round only.
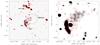 |
Fig. 1 Left – GMRT 153 MHz contours of the central field around the cluster A 521. Contours start at ±3σ153 MHz = ±2.7 mJy/b and are spaced by a factor of two. The resolution is 34.7′′ × 20.9′′, PA 59.0°. The dashed circle represents the area of 1 Mpc containing the central radio halo (same as in Fig. 1 of B08). Right – GMRT 153 MHz contours of the central diffuse emission in A 521 (halo, relic), after subtracting source A. Contours start at ±3σ153 MHz = ±4.35 mJy/b and are spaced by a factor of two, overlaid on the VLA 1400 MHz image, in greyscale (from D09; the lowest level of greyscale corresponds to the 3σ1400 MHz = 90 μJy/b, the highest corresponds to 0.55 mJy/b, and the peak flux density is 15.5 mJy/b). The two images have similar angular resolutions: 38.0′′ × 35.0′′, PA 0° at 153 MHz and 30.0′′ × 30.0′′, PA 0° at 1400 MHz. |
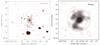 |
Fig. 2 Left – GMRT 153 MHz full-resolution image of A 697. Contours are spaced by a factor of two, starting from ±3σ153 MHz = ±2.4 mJy/b. The restoring beam is 26.2′′ × 20.8′′, PA − 89.5°. Crosses and labels mark the position of the point sources detected and optically identified at 325 MHz (M10). Right – GMRT 153 MHz low-resolution contours of the central radio halo in A 697, starting at ±3σ153 MHz = ±3.6 mJy/b and spaced by a factor of two. The resolution is 48.4′′ × 44.4′′, PA 3.5°. Contours are overlaid on the 325 MHz image (shown in greyscale, lowest level corresponding to 3σ325 MHz), at a resolution of 46.8′′ × 41.4′′, PA 79.7° (M10). |
To address the deconvolution problems due to direction-dependent ionospheric phase errors, we applied SPAM calibration and imaging to the target fields. An essential step in this approach is to individually calibrate on several bright sources within the field-of-view, a technique known as peeling (e.g., Noordam 2004). If enough calibrator sources are available, the phases can be fitted with an ionosphere model to predict phase-corrections in arbitrary viewing directions. This approach worked well for A 521 and A 697, but failed for A 1682 due to poor data quality. For A 521 and A 697 the ionospheric calibration model was applied during imaging and cleaning of all facets. For A 1682, we applied the peeling phases towards the few calibrators, but used the (non-directional) self-calibration for all other facets. The SPAM calibration and imaging were repeated twice per target. The final images of the full (3 degree) field-of-view centred on our clusters were corrected for primary beam attenuation. Details of our final images are given in Table 1.
At the end of the data reduction process, the total data loss was ~45% for A 521 and A 697; nevertheless, the quality of the final images met our requirements. The higher data loss of 57% for A1682 was caused by several power failures of the array, malfunctioning antennas, and more severe RFI and ionospheric scintillations due to day-time observing. The noise level in the final A1682 image is a factor of ~2 higher than for A521 and A697. Residual RFI and ionospheric effects are the most likely cause.
We estimate that the residual amplitude errors are of the order of ≲15%, in line with values reported for GMRT observations at this frequency (see e.g., Intema et al. 2011; Sirothia et al. 2009; Kale & Dwarakanath 2010). However, there are several factors that may affect the derived flux scale from the primary calibrator (e.g., see Intema et al. 2011). As a final step we thus checked for systematic offsets in the flux scale in each field. To this aim, we selected a number (~30) of bright and compact sources in each field, and compared the measured GMRT 153 MHz flux density with a model spectrum flux, derived using catalogue fluxes at 1.4 GHz (NVSS), 325 MHz (WENSS) and at 74 MHz (VLSS, Cohen et al. 2007). We concluded that the uncertainty in the flux density scale is of the order of 20% in each field.
For convenience, to image only the inner portion of each field without the need of wide-field imaging technique and focus on the central emission in our clusters, from the latest uv-data we subtracted all discrete radio sources in the 3-degrees field, except those in the central area of ~0.3 degrees. These “central” datasets were used to produce the final images for our analysis (Sect. 4).
4. 153 MHz images
4.1. Radio halo and relic in A 521
In Fig. 1 (left panel) we show the 153 MHz GMRT full-resolution image of the ~15′ × 15′ area containing the cluster A 521, corresponding to the cluster virial radius (RV = 2.78 Mpc; G06). The inner circle highlights the radio halo region, ~1 Mpc, and it is the same area as shown in Fig. 1 of B08.
The cluster radio emission is dominated by the extended, arc-shaped radio relic, located in the south-eastern periphery of the cluster. At this resolution, only part of the central radio halo is visible in the ~1 Mpc circular region. To properly image and analyse the radio halo and relic emission, we subtracted the clean components of all unrelated individual radio sources (compact and extended) imaged at full resolution from the central uv-data (Sect. 3). Apart from the bright source J0454-1016a, (studied in G08 and labelled A in Fig. 1), none of the compact sources detected at 1.4 GHz within either the radio halo or the relic were detected at 153 MHz (i.e. sources B and C in the relic, Fig. 2 of G08; D09). This is most likely due to the lower surface brightness sensitivity of our data. Only sources with spectra steeper than 1.5 would be detectable at 153 MHz at the sensitivity of our images.
The total flux density of source A at 153 MHz is 65 ± 13 mJy, in agreement (within the uncertainties) with its integrated spectrum in the frequency range 327 MHz–8 GHz derived in G08. To carefully subtract this source, which lies within the relic an the halo, the model image was produced cutting the innermost region of the uv-plane to avoid any possible contribution to the flux density from the underlying diffuse emission. We then subtracted the corresponding clean components from the uv-data, ensuring the consistency between the total flux density subtracted and the one measured in the full-resolution image. From the residual dataset we finally produced a low-resolution image by using robust 0 weighting and tapering the visibilities to give more weight to the shortest baselines to enhance the large-scale low-brightness radio emission.
The final low-resolution image, containing only the diffuse cluster emission, is presented in the right panel of Fig. 1. The local noise (1σ) level is 1.45 mJy/b, slightly higher than in the full-resolution image, as expected because of the resolution and weighting scheme used. For comparison with our previous images, the 153 MHz contours are overlaid on the VLA image at 1400 MHz, which has a similar angular resolution of 30′′ × 30′′ (from D09).
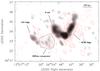 |
Fig. 3 GMRT 153 MHz contours of the central emission in A 1682, starting at ±3σ153 MHz = ±5.1 mJy/b and spaced by a factor of two. The resolution is 29.5′′ × 18.0′′, PA 53.8°. Contours are overlaid on the 240 MHz image, shown in greyscale, at a resolution of 18.3′′ × 14.0′′, PA 21.7° (Venturi et al. 2009). The lowest level of the greyscale corresponds to 3σ240 MHz = 0.75 mJy/b. |
4.1.1. Morphological considerations
The low-resolution 153 MHz image (Fig. 1, right) clearly shows that the radio relic is the brightest feature of the cluster. Its overall morphology agrees well with the 1400 MHz image. However, similarly to what is observed at 240 MHz (B08), it is slightly more elongated in the S–W edge at 153 MHz than at 1400 MHz, with a size of ~1.35 Mpc along the major axis. A radio emission, labelled “spur” in the left panel of Fig. 1, is visible just south of source A, extending westwards from the inner side of the relic. The spur is still visible in the subtracted, low-resolution image. A similar structure, partially coincident with this feature is also visible in the 240 MHz image (B08), but it is not detected in this region at 1400 MHz (Fig. 1, right). It is not clear whether the spur is related to the relic, or is part of the central radio halo.
The morphology and size of the radio halo at 153 MHz are similar to those at 1400 MHz, with the main axis slightly elongated in the N–W direction. The similarity between 153 and 1400 MHz is consistent with the fact that the two maps have a comparable surface brightness sensitivity: assuming a spectral index for the radio halo of α = 1.8 (D09), and extrapolating the image brightness sensitivity from 153 MHz to 1400 MHz, we find ≃28 μJy/b, very close to the sensitivity limit of the 1400 MHz map (30 μJy/b). The halo is slightly more extended at 240 MHz than at 153 MHz, with a faint region of emission extending towards the south that is not detected at 153 MHz (see Fig. 1 in B08). This is most likely due to the lower surface brightness sensitivity of the 153 MHz image compared to the 240 MHz one, which was obtained from a much deeper (~18 h) observation. Indeed, the surface brightness of this faint region at 153 MHz, estimated from the 240 MHz image assuming a spectral index α = 1.8 (D09), is comparable with the sensitivity limit of our 153 MHz image.
A striking feature is a “bridge” of radio emission connecting the northern part of the relic with the central radio halo (Fig. 1 right). The bridge was also observed at 1.4 GHz (D09), but it becomes much more prominent at 153 MHz and 240 MHz (B08; Fig. 1). Indeed, at these low frequencies this bridge becomes so extended that it becomes very difficult to separate the emission of the halo from that of the bright relic: large-scale diffuse emission permeates the whole cluster volume, from the inner edge of the relic to the north-west of the cluster. We note that no point sources are present in the bridge region (except for source A, which was subtracted from the u − v plane), therefore the overall emission connecting the relic and the halo is not due to inaccurate or incomplete subtraction of individual sources.
Several radio bridges, i.e. radio emission connecting the halo and relic in the same clusters, are known in the literature. Beyond the famous and prototype bridge in the Coma cluster (Kim et al. 1989), other examples are in A 2744, A 520, A 754 (Markevitch 2010; V13).
4.2. Radio halo in A 697
In the left panel of Fig. 2 we present the GMRT 153 MHz full-resolution (26.2′′ × 20.8′′) image of the A 697 cluster field, ~12′ × 12′ wide (corresponding to about half the cluster virial radius, RV = 2.9 Mpc, M10). Besides the two extended radio galaxies S1 and S2 (see Fig. 2) and one bright resolved source located south-west of the cluster centre, the faint radio halo is the dominant feature.
None of the point sources embedded in the radio halo region at 325 MHz (M10) has been detected at 153 MHz, not even source A, associated with the BGC galaxy at the cluster centre. Their location is reported in the left panel of Fig. 2 (labelled A, D, G as in Fig. 2 of M10).
Similarly to the case of A 521 (Sect. 4.1), from the uv-data we subtracted all discrete radio sources in the field and produced a low-resolution image of the radio halo, presented in the right panel of Fig. 2), overlaid on the 325 MHz image at a similar resolution (from M10). The largest linear size of the radio halo is ~1.3 Mpc, and its surface brightness is centrally peaked, as seen also at higher frequencies (see V08; van Weeren et al. 2011). The surface brightness sensitivity of the 325 MHz image is ~2–2.5 better than that at 153 MHz (assuming a spectral index of 1.6 for the radio halo, i.e. van Weeren et al. 2011), nevertheless, we managed to detect the 153 MHz radio halo emission within the region considered for the flux density measurements (Fig. 2, right).
Despite an overall agreement in size and morphology at the various frequencies, part of the emission imaged at 153 MHz is not visible at higher frequencies. This could be due to a very steep spectrum part of the halo, but the signal-to-noise ratio is too low here to allow an accurate study of the spectral index distribution in this area.
4.3. Complex diffuse emission in A 1682
The full-resolution (29.5′′ × 18′′) 153 MHz image of A 1682 is presented in Fig. 3, overlaid on a 240 MHz greyscale image at a resolution of 18.3′′ × 14′′ (Venturi et al. 2009). Our 153 MHz observations confirm that the radio emission in this cluster is very complex, which is also clear from the images at higher frequencies (V08, V11 and V13).
The cluster radio emission is dominated by two main extended sources, the E tail, a large and elongated tail of emission, connected to the central strong radio galaxy (associated to the cluster dominant galaxy, see V13), and the N–W ridge, a bright and elongated source extending from the cluster centre to the N–W region of the cluster, which diffuses into a fainter, less regular radio structure. Moreover, a smaller and fainter S–E ridge is located in the outer part of the cluster. Their morphology and brightness distribution are very similar to those at 240 MHz, despite an overall broader emission of the N–W ridge.
In addition to these sources, the 153 MHz image of A 1682 shows a “diffuse component”, a region of low surface brightness emission located close to the S–E ridge in the plane of the sky. It is coincident with a similar feature detected at 240 MHz, and its largest linear size is ~350 kpc. Compared to the images at higher frequencies, this is the most remarkable feature of the 153 MHz image (V11 and V13). All four components labelled in Fig. 3 are named following the same notation as in previous papers (V08, V11, V13).
The flux density values at 153 MHz (measured from the image in Fig. 3) and at other frequencies (V13) of the four main components of the radio emission are reported in Table 2, along with their spectral index, computed between 153 and 240 MHz. The diffuse component has a very steep spectrum, while our flux density measurement at 153 MHz leads to a flat spectrum for the S–E ridge. This result is very unusual for a diffuse radio source, and difficult to reconcile with the steepness at higher frequencies (V13); it needs further investigation. The most likely explanation is missing flux density at 153 MHz (see also Sect. 4.3.1).
4.3.1. Diffuse component
Here we focus our attention on the steep-spectrum diffuse component, the most remarkable feature in our new 153 MHz image of the cluster.
As is clear from Fig. 3, this component is already visible at 240 MHz, with S240 MHz = 46 ± 4 mJy (V13, see also Table 2). Part of its emission at 240 MHz is undetected at 153 MHz at the 3σ level, and this is likely due to the lower sensitivity of this observation (the most affected by data loss of our sample, see Sect. 3). Its total flux density, integrated over the polygonal area shown in Fig. 3, is S153 MHz = 98 ± 20 mJy. The resulting spectral index in this frequency range is  (Table 2). This value is flatter than that between 240 and 610 MHz (α = 2.09 ± 0.15, V13). This might be because that we are missing part of its flux density at 153 MHz in the integrated area, due to the very low surface brightness sensitivity at 153 MHz (estimated to be about a factor of 3 lower than that at 240 MHz, assuming a spectral index of 1.7). Alternatively, the spectral index between 240 and 610 MHz might be flatter due to possible flux density losses at 610 MHz. Despite the uncertainty in the spectral steepness, which arises from the different sensitivities of the observations, we can safely conclude that the diffuse component in A 1682 has a very steep spectrum.
Apart from the main four components, excess radio emission spread across the cluster scale (Mpc-size) both at 240 and 610 MHz was reported in V08, V11 and V13, estimated by subtraction of the individual sources (N–W ridge, E tail, S–E ridge). Hints of large-scale emission were also found from a re-analysis of VLA D-array data at 1.4 GHz (see V11). This suggests a faint, diffuse very low brightness emission.
In search for any evidence of this at 153 MHz, we subtracted the flux density of the N–W ridge, E tail and S–E ridge from the total integrated flux density over a ~1 Mpc area, and found a residual flux density of ~250 mJy at 153 MHz, and ~160 mJy at 240 MHz, consistent with a spectral slope of 1 (as found from the residual analysis in V11, and confirmed at other frequencies in V13). Considering the large uncertainties at all frequencies, it is difficult to draw any conclusion on this diffuse cluster scale residual emission and its nature from these results.
5. Spectral analysis
The high-sensitivity 153 MHz GMRT observations presented here allow us to study the spectral properties of the radio halos in A 521 and A 697, and of the relic in A 521 over more than one order of magnitude.
5.1. Integrated spectra
The integrated spectra of radio halos and relics are a crucial piece of information for our understanding of their origin, since they bear the signature of the physical processes driving their formation. So far, only a handful of integrated spectra are well sampled down to frequencies of the order of 100 MHz and below (Coma cluster, Thierbach et al. 2003; A 1914, Bacchi et al. 2003; A 2256, Brentjens 2008; van Weeren et al. 2012), but even in these cases, the resolution of the available observations is too low to separate the diffuse Mpc-scale emission from that of the embedded sources. Moreover, matching the images obtained with different instruments, techniques and resolutions introduces additional uncertainties that may seriously bias the results. One of the most outstanding features of the GMRT is the capability to perform simultaneous imaging at both high and low resolution, thanks to its antenna configuration. This allows one to isolate the emission of the halos and relics from the embedded individual sources with high accuracy.
For A 521 and A 697 we have been able to perform accurate and consistent subtraction of the discrete embedded sources at all frequencies at which they contribute to the total flux density measurements, and we have obtained integrated spectra of the “pure” diffuse emission down to 153 MHz.
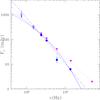 |
Fig. 4 Integrated spectra of the halo and relic sources in A 521. Radio halo spectrum (blue): the empty circle is the GMRT 153 MHz flux (this work), filled circles are measurements from B08 and D09; the power-law fit to the data weighted for the uncertainties (dashed blue line) corresponds to α = 1.85. Radio relic spectrum (magenta): filled squares are the flux density values taken from G08, the empty square is the GMRT 153 MHz flux density (this work); the magenta dashed line is the power-law fit (weighted for the uncertainties) corresponding to α = 1.45. The curved dashed and solid blue lines are the fit of homogeneous re-acceleration models, with a constant acceleration efficiency in the radio-emitting volume (constant ratio of turbulent and thermal energy densities). The magnetic field is assumed to scale with radius (azimuthally constant) as ρ2/3 (short-dashed) and as ρ (solid); flatter radial distributions of the magnetic field strength produce more synchrotron power at lower frequencies. |
5.2. Relic and halo in A 521
A detailed spectral analysis of the relic in A 521 in the frequency range 240 MHz–5 GHz was performed in G08, while the integrated spectrum of the radio halo in A 521 in the frequency range 240 MHz–1.4 GHz was studied in D09.
To obtain a 153 MHz flux density measurement consistent with the previous studies, we integrated the total flux density of the relic over the same region as in G08, and derived the total flux density of the radio halo by integrating the image in Fig. 1 (right) over the same circular area of 1 Mpc as in B08 and D09. We found S153 MHz(relic) = 297 ± 59 mJy and S153 MHz(halo) = 328 ± 66 mJy (see Table 3). We estimate that any possible contribution of point sources embedded in the relic and halo (not detected at this frequency, see Sect. 4.1) to the total 153 MHz flux density measurement is ≲2.3 mJy, well within the uncertainties of the measured flux densities. This estimate was obtained by extrapolating the total contribution of these sources at 1400 MHz (≲0.4 mJy), down to 153 MHz, assuming an average spectral index for each source of 0.7–0.8 (see D09).
The updated integrated spectra of the radio halo and of the relic are shown in Fig. 4 (blue circles and magenta squares, respectively). Filled symbols are taken from D09, while the empty ones are the new 153 MHz measurement.
We fitted both spectra with a power-law. As is clear from Fig. 4, the best fit of the halo spectrum is dependent on the inclusion of the flux density value at 610 MHz. We obtain  including this value and
  without it. The spectrum of the relic was fitted with a power-law with spectral index
  .
.
Including the flux density at 153 MHz confirms the previous values of the spectral index both for the halo (D09) and for the relic (G08).
The spectrum of the radio halo was compared to a homogeneous turbulent re-acceleration model (using Brunetti & Lazarian 2007), reported in Fig. 4 as solid and short-dashed curved blue lines. We assumed that (1) the acceleration efficiency is constant over the whole radio emitting volume, with a constant ratio of the turbulent and thermal energy density, and (2) the magnetic field strength declines with increasing radius (azimuthally constant) as ρ2/3 and as ρ (dashed and solid curved line, respectively, ρ being the density of thermal protons); the first model assumes that the magnetic field is frozen into the thermal gas, while the second model is expected by some numerical simulations (e.g., Dolag 2005). We note that some observations preferentially derive a flatter magnetic field radial distributions, i.e. B ∝ ρ1/2, expected in the case in which the magnetic energy density scales as the thermal energy density (assuming a constant gas temperature) (e.g., Coma cluster, Bonafede et al. 2010).
The long dashed blue line is a power-law with α = 1.85, the intermediate steepness between the two fits with and without the 610 MHz flux density value.
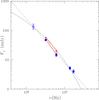 |
Fig. 5 Integrated spectrum of the radio halo in A 697. The blue empty circle is the GMRT 153 MHz measurement derived in this paper. GMRT flux density measurements and limits at 330 and 610 MHz (filled circles and red asterisks respectively) are taken from M10, while the WSRT flux densities at 1382 and 1714 MHz are taken from van Weeren et al. 2011. The dashed line is the power-law fit to the data, weighted for the uncertainties (α = 1.5); the solid curved line is from the model of homogeneous re-acceleration, with a constant acceleration efficiency in the radio-emitting volume (constant ratio of turbulent and thermal energy densities). The magnetic field is assumed to decline with radius (azimuthally constant) as ρ. The (red) butterfly and asterisks mark the fluxes at 325 and 610 MHz corrected for the missing flux (M10). |
5.3. Radio halo in A 697
For a consistent comparison with the flux density measurements in the frequency range 325 MHz–1.4 GHz (M10) we integrated the low-resolution 153 MHz image over the same circular area of ~1.3 Mpc as for the flux measurements at higher frequencies (shown by the dashed circle in Fig. 2, right panel). We find S153 MHz = 135 ± 27 mJy. We estimate that the upper limit to the contribution to the total radio halo flux density of the point sources embedded in the halo (A to G, not detected at 153 MHz, see Sect. 4.2) is ≲18 mJy. This value was obtained by extrapolating their flux density from 325 MHz assuming an average spectral index for the sources ≲1 (as derived from higher frequency measurements), and it is within the uncertainties of the flux density measurements.
The updated integrated spectrum of the halo is shown in Fig. 5. The empty circle is the new 153 MHz value; filled circles and stars at 325 MHz and 610 MHz are measurements and limits from M10 (see the paper for more details), the values at 1382 and 1710 MHz are the recent WSRT measurements reported by van Weeren et al. 2011 (see Table 3 for the values).
The data points can be fitted with a single power-law spectrum down to 153 MHz, with a slope that is only marginally affected by the results of the detailed analysis on the missing flux density performed in M10. In particular,  and
and  for the observed (blue circles) and corrected (red stars) GMRT values (M10). This value is slightly flatter than reported in van Weeren et al. 2011 in the frequency range 325 MHz–1.7 GHz, as our 153 MHz flux density measurement is below the extrapolation of their power-law.
The shape and steepness of the spectrum of the radio halo in A 697 were compared to a homogeneous turbulent re-acceleration model (Brunetti & Lazarian 2007). The result is plotted in Fig. 5 for a magnetic field intensity scaling as ρ. The dashed line is a power-law with spectral index α = 1.5.
6. Discussion
We have presented high-sensitivity and high-resolution GMRT observations at 153 MHz of the very low surface brightness diffuse emission in the galaxy clusters A 521, A 697 and A 1682, which belongs to the GMRT Radio Halo Cluster Sample and were extensively studied over a very wide range of frequencies, from 153 MHz to 1.4 GHz. Despite the massive data editing as a consequence of the strong RFI at this frequency, the quality of our final images is very good, with 1σ noise level in the range 0.8–1.7 mJy b-1.
Our observations almost double the spectral information available to date for cluster radio halos and relics in a range of frequencies, which is critical for our understanding of their origin and evolution.
6.1. Relic source in A 521
The spectrum of the relic in A 521 among the best sampled in the literature, with six flux density measurements in the frequency range 153 MHz–5 GHz. The integrated spectrum of the relic down to 153 MHz is consistent with a power-law fit with slope α = 1.45 (Fig. 4), confirming the previous results (G08, B08). G08 discussed in detail the possible models for its origin, and concluded that the most likely is the Fermi-I diffusive shock acceleration scenario, in which the relativistic electrons responsible for the radio emission are directly accelerated from the thermal gas due to the passage of a merger shock wave (e.g., Ensslin et al. 1998; Hoeft & Brüggen 2007). Our result shows that a power-law spectrum still holds down to 153 MHz, which also supports the diffusive shock acceleration scenario. Moreover, the presence of a shock front in the X-ray gas at the location of the relic has recently been revealed by an XMM analysis of the cluster as a density and temperature jump (Bourdin et al. 2013).
In the shock acceleration model the Mach number of the shock responsible for the acceleration of the electrons is directly related to the observed slope of the power-law spectrum: for α = 1.45, the corresponding Mach number of the shock is ~2.3 (see G08 for more details). This is consistent with the Mach number estimated from the X-ray density jump, M = 2.4 ± 0.2 (Bourdin et al. 2013). The single power-law spectrum poses a new challenge, since it requires that a weak shock, such as that in A 521, is able to channel a substantial fraction of the shock energy into acceleration of the relativistic electrons (Kang et al. 2012).
6.2. Origin of the very steep spectrum radio halos in A 521 and A 697
Figures 4 and 5 show the observed spectrum of the radio halo in A 521 and A 697, overlaid with the best-fit power-law (straight dashed line in both cases) and the turbulent re-acceleration model (curved lines). Our data confirm that the power-law spectrum with the steepness derived in previous works (B08 and D08 for A 521; M10 and van Weeren et al. 2011 for A 697) still holds at 153 MHz. In both cases it is impossible to distinguish between a simple power-law shape and a curved shape, as expected from homogeneous re-acceleration models. In particular:
-
(i)
The very steep power-law spectrum ofthe A 521 radio halo, with
 in the range 1.8–1.9, implies that the spectrum of the emitting electrons be extremely steep, i.e. δinj ~ 3.8. Based on simple energetic arguments, we expect that the spectrum flattens at very low frequencies. Indeed, extrapolating such a steep power-law spectrum down to trans-relativistic energies would imply an uncomfortably large energy budget in the form of relativistic electrons; the situation becomes even more severe if we extrapolate such a power-law spectrum to supra-thermal energies. The case of A 521 is similar to the Coma radio halo spectrum, which is straight if we restrict our analysis to the ~600 MHz–5 GHz frequency range, while the curvature becomes clear with the inclusion of the flux density measurements at lower frequencies (Thierbach et al. 2003). The upper limit at 74 MHz, derived from the VLSS, is very close to the power-law extrapolation with α = 1.85, therefore we trust that future observations at ≤100 MHz with LOFAR will allow a direct test of the presence of a spectral curvature.
 -
(ii)
For A 697, the steepness of the best-fit power-law,
 , implies that the power law of the emitting electrons is δinj ~ 3. Even this value, extrapolated to very low frequencies (energies), implies that the energy budget in the form of relativistic electrons becomes very large. This would lead to a contradictory case, where the acceleration mechanism is poorly efficient (as suggested by the steep spectrum) but, at the same time, it is able to extract a substantial fraction of the energy in the ICM in the form of cosmic rays. Even for this cluster, future observations at the frequencies offered by LOFAR will allow one to test whether there is spectral curvature.
The curved spectra shown in Figs. 4 and 5 have been derived assuming homogeneous models. However, the recent LOFAR observations of A 2256 (van Weeren et al. 2012) suggest that the situation may be more complex, at least for that cluster. Turbulence can be intermittent and not homogeneous, and the ratio between turbulent and thermal energy density may change with space and time in the radio-emitting volume. Under that hypothesis, the spectrum of the emitting electrons would be a mix of different populations of accelerated particles, and as a result of this, the synchrotron spectrum, integrated along the line of sight, would be more complex than those reported in Figs. 4 and 5.
In addition, homogeneous models assume an azimuthally-averaged value of the magnetic field in the radio halo, while a better representation of its properties should take into account point-to-point variations (or scatter) of the field intensity across this averaged value. If the magnetic field is inhomogeneous, the resulting synchrotron spectrum would be stretched in frequency, making any spectral curvature even smoother and more difficult to observe.
Despite the difficulty to distinguish different models and to provide detailed theoretical predictions for inhomogeneous media, the most relevant fact arising from our observations is the confirmation of the very steep spectrum of these two radio halos. For a given radio luminosity at 1.4 GHz the energy budget required in the form of relativistic electrons in a halo with a spectral index α ~ 1.85 (A 521) is about 104 times larger than that required in a halo with a spectrum α = 1.2, provided that the spectral energy distribution of relativistic electrons can be extrapolated to lower (trans-relativistic) energies assuming a power-law with an injection slope δinj = 2α.
This analysis highlights how seriously difficult it is to explain the origin of ultra-steep spectrum halos, and provides the reason for the need of a flattening of the relativistic electrons (and synchrotron) spectrum at low energies (frequencies).
6.3. A hidden radio halo in A 1682?
Our 153 MHz observations confirm that the radio emission at the centre of A 1682 is very complex and difficult to fit into our current knowledge of diffuse cluster scale emission.
At 153 MHz all four main components of emission visible at higher frequencies have been clearly identified (Fig. 3, Table 2). For a qualitative comparison of the non-thermal and thermal properties of this complex merging cluster, in Fig. 6 we showed the 153 MHz radio emission of the cluster centre overlaid on the Chandra X-ray smoothed image (taken from archive data, Obs. Id. 3244, ACIS-I, exposure 10 ks, no analysis was performed). The gas distribution in A 1682 is clearly disturbed, with two main condensations, of which the north-western one is being considerably brighter and more extended than the south-eastern one. We note a clear offset between the radio galaxy associated with the brightest cluster galaxy (BCG) and the peak of the X-ray cluster emission, which is another hint of the disturbed dynamical status of the system. The bright part of the N–W ridge is located just outside the central brightest X-ray region, while the fainter radio extension to the west/north-west lies in a more peripheral area, at the edge of the cluster X-ray emission. The S–E ridge, too, is located in a peripheral region of very faint X-ray emission. The steep spectrum diffuse component (see Sect. 4.3.1) lies in between the two condensations, in a region of decreased X-ray surface brightness.
Despite the available multifrequency radio observation, the nature of each component remains enigmatic. A recent spectral analysis of the E-tail (V13) shows that its connection with the cluster BCG is unlikely, while the elongated shape, size (~600 kpc), spectrum (Table 2) and peripheral location (Fig. 6) of the N–W ridge are suggestive of a radio relic (see also V13).
The most intriguing feature is the diffuse component. Our data confirm its very steep spectrum (α ≲ 1.7; see also Table 2). One possible explanation for the nature of this structure is that we are looking at the brightest region of an underlying, very low surface brightness giant radio halo, which is suggested by positive residuals of emission over a scale of ~1 Mpc, detected at 153 MHz, 240 MHz and 610 MHz (this work, V08, V13, see Sect. 4.3). An alternative possibility is that this component is associated to a dying radio galaxy. The elongated morphology imaged at 153 MHz, coupled with the location at the border of the X-ray emission, are also suggestive of a relic source, but this interpretation is difficult to reconcile with the detections at higher frequencies.
A 1682 was recently observed with LOFAR (August 2011) as part of the telescope commissioning LBA (Low Band Array; 15–77 MHz) observations; preliminary images around 60 MHz confirm the complex emission in this cluster and, in particular, the steep spectrum diffuse component (Macario et al., in prep.).
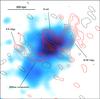 |
Fig. 6 GMRT 153 MHz radio contours of A 1682 (same as in Fig. 3), overlaid on the archival Chandra smoothed X-ray image. |
7. Summary and conclusions
We have presented GMRT 153 MHz high-sensitivity imaging of the diffuse cluster scale emission in the three galaxy clusters A 521, A 697 and A 1682. Despite the massive presence of RFI at this frequency, resulting in a considerable fraction of data removal during the editing process, our images are of very good quality, with 1σ noise level in the range 0.8–1.7 mJy b-1 in the full-resolution images. All clusters belong to the GMRT Radio Halo Cluster Sample (Venturi et al. 2007, V08) and have been observed with the GMRT also at 240, 325 and 610 MHz (B08, G08, M10, V11 and V13) and with the VLA at 1.4 GHz (D09, G08). Our spectral coverage thus covers about one order of magnitude in frequency.
The morphology and brightness distribution of the radio halo and relic in A 521 are similar to those at higher frequencies, and its size is similar to what has been imaged at 1.4 GHz (D09). Part of the halo was missed at this frequency, compared to the 240 MHz images (B08), most likely as consequence of the lower quality of the 153 MHz images. At this frequency, the halo and the relic are connected by a bridge of emission, as has been found for some clusters observed at frequencies ≲325 MHz (V13, Markevitch 2010).
The radio halo in A 697 is centrally peaked at 153 MHz, and its brightness distribution decreases radially. At the sensitivity level of our observations, the size of the radio halo is the same as detected at 325 MHz, i.e. ~1.3 Mpc (M10).
Our observations confirm the diffuse component in A 1682, a steep-spectrum region of emission located south-east of the cluster centre detected just above the sensitivity level of the GMRT observations at 610 MHz and 240 MHz (V08, V11). Its classification and origin is still under investigation, as well as the whole central radio emission in A 1682. Our observations confirm that each component has an overall steep spectrum.
We derived the integrated spectrum of the radio halos in A 521 and A 697 and of the relic in A 521. In each case our analysis was based on consistent flux density measurements, derived after carefully subtracting the embedded sources at all frequencies. Our spectra are among the most accurate derived so far for diffuse cluster scale emission. The previous findings of very steep spectrum sources have been confirmed by our 153 MHz observations. The spectrum of the relic in A 521 is a power-law with slope  . The very steep spectrum radio halo in A 521 and A 697 holds at least down to 153 MHz. In particular, for the halo A 521 the slope of the spectrum is in the range
  depending on whether the 610 MHz data point (which is known to suffer from major uncertainties) is included, while the spectral index we derived for A 697 with by adding the 153 MHz flux density measurement is
  , slightly flatter than the previous measurements (M10; van Weeren et al. 2011), though all values are still consistent with each other within the errors.
Steep-spectrum radio halos provide important clues on the origin of the radiating electrons. On one hand, their steep spectrum poses severe challenges to the secondary models (B08, M10), on the other, the re-acceleration scenario requires that we are sampling the steep region of the spectrum before the low-frequency flattening takes place.
For the giant radio halos in A 521 and A 697 we compared their integrated spectra with the models derived assuming homogeneous turbulent re-acceleration. In both cases the frequency coverage from 153 MHz to 1.4 GHz does not allow one to distinguish between possible models, since under those assumptions, a low-frequency spectral flattening should become clearly visible only below 100 MHz. The very steep spectrum of both halos argues in favour of a flattening because a very large energy budget would be required if the single power-law approximation were extended at much lower frequencies. One weakness of our analysis might be the assumption of homogeneous models, but at this stage it is difficult to provide details in case of inhomogeneity. The forthcoming LOFAR high-sensitivity observations below 100 MHz will allow us to test for a low-frequency flattening of the spectrum of radio halos, thus providing conclusive clues on the problem of their origin.
Acknowledgments
We thank the anonymous referee for useful comments. We warmly thank N. Khantaria for her help with the observations and invaluable suggestions during the data reduction. We thank the staff of the GMRT for their help during the observations. GMRT is run by the National Centre for Radio Astrophysics of the Tata Institute of Fundamental Research. This work has been partially supported by contract PRIN INAF 2008. G.M. and C.F. acknowledge financial support by the “Agence Nationale de la Recherche” through grant ANR-09-JCJC-0001-01. H.T.I. acknowledges financial support through a Jansky Fellowship of the National Radio Astronomy Observatory, which is operated by Associated Universities, Inc., under cooperative agreement with the National Science Foundation. S.G. acknowledges the support of NASA through Einstein Postdoctoral Fellowship PF0-110071 awarded by the Chandra X-ray Center (CXC), which is operated by the Smithsonian Astrophysical Observatory (SAO).
References
- Athreya, R. 2009, ApJ, 696, 885 [NASA ADS] [CrossRef] [Google Scholar]
- Bacchi, M., Feretti, L., Giovannini, G., et al. 2003, A&A, 400, 465 [NASA ADS] [CrossRef] [EDP Sciences] [Google Scholar]
- Blasi, P., & Colafrancesco, S. 1999, APh, 12, 169 [NASA ADS] [Google Scholar]
- Bonafede, A., Feretti, L., & Giovannini, G. 2009, A&A, 503, 707 [NASA ADS] [CrossRef] [EDP Sciences] [Google Scholar]
- Bonafede, A., Feretti, L., & Murgia, M. 2010, A&A, 513, A30 [NASA ADS] [CrossRef] [EDP Sciences] [Google Scholar]
- Bourdin, H., Mazzotta, P., Markevitch, M., et al. 2013, ApJ, 764, 82 [NASA ADS] [CrossRef] [Google Scholar]
- Brentjens, M. A. 2008, A&A, 489, 69 [NASA ADS] [CrossRef] [EDP Sciences] [Google Scholar]
- Bridle, A., & Greisen, E. 1994, The NRAO AIPS Project – A Summary, AIPS Memo 87, Tech. Rep. [Google Scholar]
- Brunetti, G. 2004, JKAS, 37, 493 [NASA ADS] [CrossRef] [Google Scholar]
- Brunetti, G., & Lazarian, A. 2007, MNRAS, 378, 245 [NASA ADS] [CrossRef] [Google Scholar]
- Brunetti, G., Setti, G., Feretti, L., et al. 2001, MNRAS, 320, 365 [NASA ADS] [CrossRef] [Google Scholar]
- Brunetti, G., Venturi, T., Dallacasa, D., et al. 2007, ApJ, 670, L5 [NASA ADS] [CrossRef] [Google Scholar]
- Brunetti, G., Giacintucci, S., Cassano, R., et al. 2008, Nature, 455, 944 (B08) [NASA ADS] [CrossRef] [Google Scholar]
- Cassano, R., Ettori, S., Giacintucci, S., et al. 2010, ApJ, 721, 82 [Google Scholar]
- Cohen, A. S., Lane, W. M., Cotton, W. D., et al. 2007, AJ, 134, 1245 [NASA ADS] [CrossRef] [Google Scholar]
- Condon, J. J., Cotton, W. D., Greisen, E. W., et al. 1998, AJ, 115, 1693 [NASA ADS] [CrossRef] [Google Scholar]
- Cotton, W. D. 2008, PASP, 120, 439 [NASA ADS] [CrossRef] [Google Scholar]
- Dallacasa, D., Brunetti, G., Giacintucci, S., et al. 2009, ApJ, 699, 1288 (D09) [NASA ADS] [CrossRef] [Google Scholar]
- Dahle, H., Kaiser, N., Irgens, R. J., et al. 2002, ApJS, 139, 313 [NASA ADS] [CrossRef] [Google Scholar]
- Dennison, B. 1980, ApJ, 239, L93 [NASA ADS] [CrossRef] [Google Scholar]
- Dolag, K., Vazza, F., Brunetti, G., & Tormen, G. 2005, MNRAS, 364, 753 [NASA ADS] [CrossRef] [Google Scholar]
- Donnert, J., Dolag, K., Brunetti, G., Cassano, R., & Bonafede, A. 2010, MNRAS, 401, 47 [NASA ADS] [CrossRef] [Google Scholar]
- Ensslin, T. A., Biermann, P. L., Klein, U., & Kohle, S. 1998, A&A, 332, 395 [NASA ADS] [Google Scholar]
- Ferrari, C., Maurogordato, S., Cappi, A., & Benoist, C. 2003, A&A, 399, 813 [NASA ADS] [CrossRef] [EDP Sciences] [Google Scholar]
- Ferrari, C., Arnaud, M., Ettori, S., et al. 2006, A&A, 446, 417 [NASA ADS] [CrossRef] [EDP Sciences] [Google Scholar]
- Ferrari, C., Govoni, F., Schindler, S., et al. 2008, Space Sci. Rev., 134, 93 [NASA ADS] [CrossRef] [Google Scholar]
- Giacintucci, S. 2011, Mem. Soc. Astron. It., 82, 541 [NASA ADS] [Google Scholar]
- Giacintucci, S., Venturi, T., Bardelli, S., et al. 2006, New Astron., 11, 437 [NASA ADS] [CrossRef] [Google Scholar]
- Giacintucci, S., Venturi, T., Macario, G., et al. 2008, A&A, 486, 347 (G08) [NASA ADS] [CrossRef] [EDP Sciences] [Google Scholar]
- Girardi, M., Boschin, W., & Barrena, R. 2006, A&A, 455, 45 [NASA ADS] [CrossRef] [EDP Sciences] [Google Scholar]
- Hoeft, M., & Brüggen, M. 2007, MNRAS, 375, 77 [NASA ADS] [CrossRef] [Google Scholar]
- Intema, H. T., van der Tol, S., Cotton, W. D., et al. 2009, A&A, 501, 1185 [NASA ADS] [CrossRef] [EDP Sciences] [Google Scholar]
- Intema, H. T., van Weeren, R. J., Röttgering, H. J. A., et al. 2011, A&A, 535, A38 [NASA ADS] [CrossRef] [EDP Sciences] [Google Scholar]
- Kale, R., & Dwarakanath, K. S. 2009, ApJ 699, 1883 [Google Scholar]
- Kale, R., & Dwarakanath, K. S. 2010, ApJ, 718, 939 [NASA ADS] [CrossRef] [Google Scholar]
- Kang, H., Ryu, D., & Jones, T. W. 2012, ApJ, 756, 97 [Google Scholar]
- Kettenis, M., van Langevelde, H. J., Reynolds, C., et al. 2006, in Astronomical Data Analysis Software and Systems, XV, ASP Conf. Ser., 351, 497 [Google Scholar]
- Kim, K.-T., Kronberg, P. P., Giovannini, G., & Venturi, T. 1989, Nature, 341, 720 [NASA ADS] [CrossRef] [Google Scholar]
- Macario, G., Venturi, T., Brunetti, G., et al. 2010, A&A, 517, A43 (M10) [NASA ADS] [CrossRef] [EDP Sciences] [Google Scholar]
- Macario, G., Markevitch, M., Giacintucci, S., et al. 2011, ApJ, 728, 82 [NASA ADS] [CrossRef] [Google Scholar]
- Mazzotta, P., Bourdin, P., Giacintucci, S., & Venturi, T. 2011, Mem. Soc. Astron. It., 82, 495 [NASA ADS] [Google Scholar]
- Markevitch, M. 2010, Review talk at 12th Marcel Grossman Meeting, Paris, July 2009 [arXiv:1010.3660] [Google Scholar]
- Morrison, G. E., Owen, F. N., Ledlow, M. J., et al. 2003, ApJSS, 146, 267 [NASA ADS] [CrossRef] [Google Scholar]
- Noordam, J. E. 2004, Proc. SPIE, 5489, 817 [NASA ADS] [CrossRef] [Google Scholar]
- Ogrean, G., Brüggen, M., Röttgering, H., et al. 2013, MNRAS, 429, 2617 [NASA ADS] [CrossRef] [Google Scholar]
- Petrosian, V. 2001, ApJ, 557, 560 [NASA ADS] [CrossRef] [Google Scholar]
- Rengelink, R. B., Tang, Y., de Bruyn, A. G., et al. 1997, A&AS, 124, 259 [NASA ADS] [CrossRef] [EDP Sciences] [Google Scholar]
- Scaife, A. M. M., & Heald, G. H. 2012, MNRAS, 423, L30 [NASA ADS] [CrossRef] [Google Scholar]
- Schlickeiser, R., Sievers, A., & Thiemann, H. 1987, A&A, 182, 21 [NASA ADS] [Google Scholar]
- Sirothia, S. K., Saikia, D. J., Ishwara-Chandra, C. H., et al. 2009, MNRAS, 392, 1403 [NASA ADS] [CrossRef] [Google Scholar]
- Thierbach, M., Klein, U., & Wielebinski, R. 2003, A&A, 397, 53 [NASA ADS] [CrossRef] [EDP Sciences] [Google Scholar]
- van Weeren, R. J., Brüggen, M., Röttgering, H. J. A., et al. 2011, A&A, 533, A35 [NASA ADS] [CrossRef] [EDP Sciences] [Google Scholar]
- van Weeren, Röttgering, H. J. A., Rafferty, D., et al. 2012, A&A, 543, A43 [NASA ADS] [CrossRef] [EDP Sciences] [Google Scholar]
- Venturi, T. 2011, Mem. It. Astron. Soc., 82, 499 [Google Scholar]
- Venturi, T., Giacintucci, S., Brunetti, G., et al. 2007, A&A, 463, 937 [NASA ADS] [CrossRef] [EDP Sciences] [Google Scholar]
- Venturi, T., Giacintucci, S., Dallacasa, D., et al. 2008, A&A, 484, 327 (V08) [NASA ADS] [CrossRef] [EDP Sciences] [Google Scholar]
- Venturi, T., Giacintucci, S., Cassano, R., et al. 2009, ASPC, 407, 232 [Google Scholar]
- Venturi, T., Giacintucci, S., & Dallacasa, D. 2011, JApA, 32, 501 (V11) [Google Scholar]
- Venturi, T., Giacintucci, S., Dallacasa, D., et al. 2013, A&A, 551, A24 (V13) [NASA ADS] [CrossRef] [EDP Sciences] [Google Scholar]
All Tables
All Figures
|
Fig. 1 Left – GMRT 153 MHz contours of the central field around the cluster A 521. Contours start at ±3σ153 MHz = ±2.7 mJy/b and are spaced by a factor of two. The resolution is 34.7′′ × 20.9′′, PA 59.0°. The dashed circle represents the area of 1 Mpc containing the central radio halo (same as in Fig. 1 of B08). Right – GMRT 153 MHz contours of the central diffuse emission in A 521 (halo, relic), after subtracting source A. Contours start at ±3σ153 MHz = ±4.35 mJy/b and are spaced by a factor of two, overlaid on the VLA 1400 MHz image, in greyscale (from D09; the lowest level of greyscale corresponds to the 3σ1400 MHz = 90 μJy/b, the highest corresponds to 0.55 mJy/b, and the peak flux density is 15.5 mJy/b). The two images have similar angular resolutions: 38.0′′ × 35.0′′, PA 0° at 153 MHz and 30.0′′ × 30.0′′, PA 0° at 1400 MHz. |
| In the text | |
|
Fig. 2 Left – GMRT 153 MHz full-resolution image of A 697. Contours are spaced by a factor of two, starting from ±3σ153 MHz = ±2.4 mJy/b. The restoring beam is 26.2′′ × 20.8′′, PA − 89.5°. Crosses and labels mark the position of the point sources detected and optically identified at 325 MHz (M10). Right – GMRT 153 MHz low-resolution contours of the central radio halo in A 697, starting at ±3σ153 MHz = ±3.6 mJy/b and spaced by a factor of two. The resolution is 48.4′′ × 44.4′′, PA 3.5°. Contours are overlaid on the 325 MHz image (shown in greyscale, lowest level corresponding to 3σ325 MHz), at a resolution of 46.8′′ × 41.4′′, PA 79.7° (M10). |
| In the text | |
|
Fig. 3 GMRT 153 MHz contours of the central emission in A 1682, starting at ±3σ153 MHz = ±5.1 mJy/b and spaced by a factor of two. The resolution is 29.5′′ × 18.0′′, PA 53.8°. Contours are overlaid on the 240 MHz image, shown in greyscale, at a resolution of 18.3′′ × 14.0′′, PA 21.7° (Venturi et al. 2009). The lowest level of the greyscale corresponds to 3σ240 MHz = 0.75 mJy/b. |
| In the text | |
|
Fig. 4 Integrated spectra of the halo and relic sources in A 521. Radio halo spectrum (blue): the empty circle is the GMRT 153 MHz flux (this work), filled circles are measurements from B08 and D09; the power-law fit to the data weighted for the uncertainties (dashed blue line) corresponds to α = 1.85. Radio relic spectrum (magenta): filled squares are the flux density values taken from G08, the empty square is the GMRT 153 MHz flux density (this work); the magenta dashed line is the power-law fit (weighted for the uncertainties) corresponding to α = 1.45. The curved dashed and solid blue lines are the fit of homogeneous re-acceleration models, with a constant acceleration efficiency in the radio-emitting volume (constant ratio of turbulent and thermal energy densities). The magnetic field is assumed to scale with radius (azimuthally constant) as ρ2/3 (short-dashed) and as ρ (solid); flatter radial distributions of the magnetic field strength produce more synchrotron power at lower frequencies. |
| In the text | |
|
Fig. 5 Integrated spectrum of the radio halo in A 697. The blue empty circle is the GMRT 153 MHz measurement derived in this paper. GMRT flux density measurements and limits at 330 and 610 MHz (filled circles and red asterisks respectively) are taken from M10, while the WSRT flux densities at 1382 and 1714 MHz are taken from van Weeren et al. 2011. The dashed line is the power-law fit to the data, weighted for the uncertainties (α = 1.5); the solid curved line is from the model of homogeneous re-acceleration, with a constant acceleration efficiency in the radio-emitting volume (constant ratio of turbulent and thermal energy densities). The magnetic field is assumed to decline with radius (azimuthally constant) as ρ. The (red) butterfly and asterisks mark the fluxes at 325 and 610 MHz corrected for the missing flux (M10). |
| In the text | |
|
Fig. 6 GMRT 153 MHz radio contours of A 1682 (same as in Fig. 3), overlaid on the archival Chandra smoothed X-ray image. |
| In the text | |
Current usage metrics show cumulative count of Article Views (full-text article views including HTML views, PDF and ePub downloads, according to the available data) and Abstracts Views on Vision4Press platform.
Data correspond to usage on the plateform after 2015. The current usage metrics is available 48-96 hours after online publication and is updated daily on week days.
Initial download of the metrics may take a while.