Fig. 3
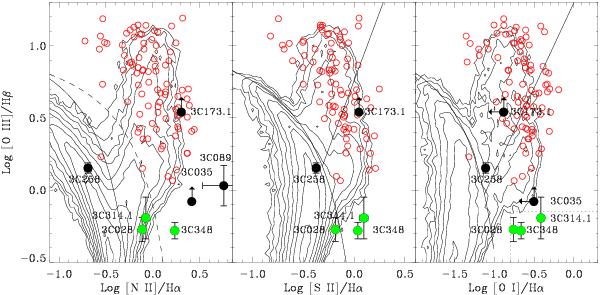
Contours: density of SDSS emission-line galaxies in the optical diagnostic diagrams (adapted from Kewley et al. 2006); only galaxies with lines measured with a signal-to-noise ratio  5 are included. Levels are in geometric sequence with a common ratio of 2. Galaxies below the curved solid lines are star-forming galaxies. In the left diagram, the dashed curve marks the transition from composite galaxies to AGN; in the middle and right panels, the oblique line separate LINER from Seyfert. The empty circles are the 3CR sources with z < 0.3, while the filled circles are the ELEGs (green) and the candidates (black). In the right diagram, the region bounded by the dotted lines defines the “relic neighbors” (see Sect. 5).
Current usage metrics show cumulative count of Article Views (full-text article views including HTML views, PDF and ePub downloads, according to the available data) and Abstracts Views on Vision4Press platform.
Data correspond to usage on the plateform after 2015. The current usage metrics is available 48-96 hours after online publication and is updated daily on week days.
Initial download of the metrics may take a while.