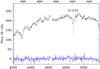
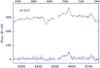
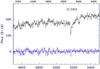
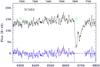
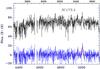
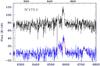
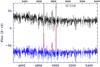
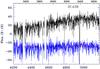
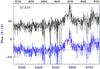
Fig. 1
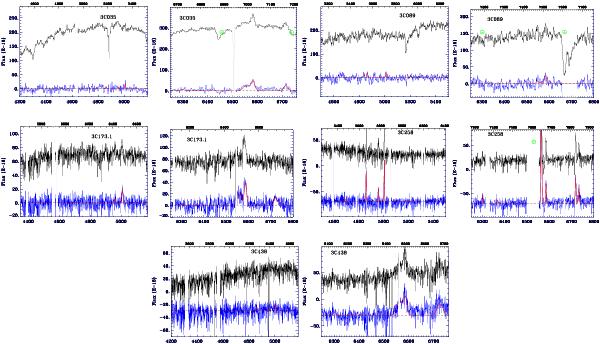
For each of five the candidate relic RGs, the blue and red spectra are shown. The fluxes are in units of erg cm-2 s-1 Å-1, while the wavelengths are in Å. The upper axes of the spectra show the observed wavelengths while the lower axes show the rest frame wavelengths. The bottom blue spectra in each panel are the residuals after the subtraction of the stellar continuum; shown in red is the fit to the residuals which includes the emission-lines. For 3C 089, we rebin the spectrum to a 3 Å resolution to show more clearly the weak emission-lines. The main telluric absorption bands are indicated with circled crosses.

Current usage metrics show cumulative count of Article Views (full-text article views including HTML views, PDF and ePub downloads, according to the available data) and Abstracts Views on Vision4Press platform.
Data correspond to usage on the plateform after 2015. The current usage metrics is available 48-96 hours after online publication and is updated daily on week days.
Initial download of the metrics may take a while.