| Issue |
A&A
Volume 551, March 2013
|
|
|---|---|---|
| Article Number | A89 | |
| Number of page(s) | 6 | |
| Section | Extragalactic astronomy | |
| DOI | https://doi.org/10.1051/0004-6361/201220652 | |
| Published online | 28 February 2013 | |
The average GeV-band emission from gamma-ray bursts
1
DESY,
15738
Zeuthen,
Germany
e-mail:
This email address is being protected from spambots. You need JavaScript enabled to view it.
2
Institute of Physics and Astronomy, University of Potsdam,
14476
Potsdam,
Germany
Received: 29 October 2012
Accepted: 11 January 2013
Abstract
Aims. We analyze the emission in the 0.3–30 GeV energy range of gamma-ray bursts detected with the Fermi Gamma-ray Space Telescope. We concentrate on bursts that were previously only detected with the Gamma-Ray Burst Monitor in the keV energy range. These bursts will then be compared to the bursts that were individually detected with the Large Area Telescope at higher energies.
Methods. To estimate the emission of faint GRBs we used nonstandard analysis methods and sum over many GRBs to find an average signal that is significantly above background level. We used a subsample of 99 GRBs listed in the Burst Catalog from the first two years of observation.
Results. Although most are not individually detectable, the bursts not detected by the Large Area Telescope on average emit a significant flux in the energy range from 0.3 GeV to 30 GeV, but their cumulative energy fluence is only 8% of that of all GRBs. Likewise, the GeV-to-MeV flux ratio is less and the GeV-band spectra are softer. We confirm that the GeV-band emission lasts much longer than the emission found in the keV energy range. The average allsky energy flux from GRBs in the GeV band is 6.4 × 10⁻⁴ erg cm-2 yr-1 or only ~4% of the energy flux of cosmic rays above the ankle at 1018.6 eV.
Key words: methods: statistical / surveys / gamma-ray burst: general
© ESO, 2013
1. Introduction
Since its launch in June 2008 the Fermi Gamma-ray Space Telescope has broadened our understanding of gamma-ray bursts (GRBs). The two main instruments on board of the satellite are the Gamma-Ray Burst Monitor (GBM, Meegan et al. 2009) and the Large Area Telescope (LAT, Atwood et al. 2009). Together they are capable of observing GRBs over seven decades of energy. Especially the LAT that covers the high-energy region from 30 MeV to 300 GeV has the potential to provide new insight into the underlying physics of GRBs. However, only a small fraction of the GRBs detected with the GBM have been individually detected with the LAT (Gehrels et al. 2009).
Whereas the keV-MeV emission may well be quasi-thermal emission, i.e. of photospheric origin (Eichler & Levinson 2000; Ryde & Pe’er 2009; Pe’er et al. 2012), the GeV-band emission is indicative of particle acceleration to very high energies, and it can potentially probe whether GRBs are powerful enough to provide a significant part of ultrahigh-energy cosmic rays (Kotera & Olinto 2011; Eichler & Pohl 2011). Recently, the GeV-band energy output of GRBs was estimated on the basis of the relatively few GRBs, which are individually detected with Fermi-LAT, and found smaller than the source power needed to sustain cosmic rays above the ankle in the spectrum, at 1018.6 eV (Eichler et al. 2010). One source of uncertainty in this statement is the unknown level of high-energy photon output of the many GRBs not individually detected with LAT (Waxman 2010).
Here we re-analyze data of the Fermi-LAT detector with a view to inferring the GeV-band high-energy emission from GRBs. In earlier studies the focus was placed on studying each burst individually (e.g. Abdo et al. 2011; Ackermann et al. 2012c; Zheng et al. 2012a,b). However, by analyzing many GRBs together, one is able to obtain more precise results for the emission of GRBs. Therefore, we placed the focus on bursts that do not show any significant signal in the GeV range when analyzed individually. A subsample of 99 GRBs has been defined that were in principle detectable with Fermi-LAT and occurred in regions of low background emission coming from other galactic and cosmic sources. For each burst the spectrum of expected background photons and an effective area is estimated. Together with the spectrum of observed photons, we thus determine the fluence from these bursts.
2. Framework
Most of the GRBs detected by the GBM do not trigger the LAT. Therefore it is expected that most of the GRBs do not show any significant signal above the background. The bursts that did not trigger the LAT will be referred to as GBM-detected bursts. We determine their emission by counting LAT-detected photons within a certain time interval and a certain solid-angle element, henceforth referred to as the area of integration (AOI). The choice of the time window of observation and the AOI is important, because GeV emission can be delayed (Abdo et al. 2010) and the GRB position is typically not well determined by the GBM. For long observation times and a large AOI, the signal might not be distinguished from the background, while for short observations and a small AOI the emission could simply be missed. A few general considerations are therefore in order.
2.1. Energy intervals
In general the LAT is designed to detect photons in an energy range of 30 MeV to 300 GeV (Rando 2009). The analysis could in principle be performed for the entire energy range, but the sensitivity of the detector varies with energy. The effective area of the LAT has been derived through Monte Carlo simulations and verified with flight data (Ackermann et al. 2012a), and it is is very low for energies around 100 MeV in comparison to GeV energies. Thus at low energies the number of detected photons is low, but they represent a large portion of the flux because the actual photon flux is normally a decreasing function of the energy (Ackermann et al. 2012b). Additionally, the reconstruction of the photon arrival direction is less precise for lower energies, which further reduces the signal-to-background ratio. As a result the detection significance for energies below ≲300 MeV should be very low and the flux determination uncertain. We therefore only analyze the energy interval from 300 MeV to 30 GeV.
2.2. Time intervals
Recent studies of the GeV-band emission from GRBs suggest a significant production of highly energetic photons long after the prompt emission at keV–MeV energies (e.g. Abdo et al. 2009; Rubtsov et al. 2012), mandating that the GRBs be monitored for long time intervals after the prompt emission phase. The duration of GRBs is characterized by T90, the mid time in which 90% of the fluence is observed in the BATSE energy range (50 keV to 300 keV). The duration of the GBM emission phase and the LAT emission phase is likely to be correlated, so it is reasonable to choose time intervals as multiples of T90 rather than as absolute time periods.
2.3. Area of integration
From the GBM and other observatories the position of every burst is known with a precision of up to 1°, while data from other observatories or a combined analysis may permit a localization accuracy in the arcsecond range. A comparison of such localizations indicates a systematic error in the positioning of the GRBs with GBM. The best fit for the systematic error is the combination of two Gaussians with dispersion 2.6° with 72% weight and 10.4° with 28% weight, to be added in quadrature to the statistical error (Paciesas et al. 2012). The expected distribution of GBM burst localization errors are shown in Fig. 1. For all other localization sources we neglect systematic errors.
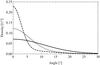 |
Fig. 1 Expected GBM localization accuracy for 1° (dashed), 5° (fine dashed) and 10° (continous) statistical error radius. A normal distribution is assumed for the statistical error. |
The imperfect angular reconstruction of the LAT, characterized by the point-spread function (PSF), may lead to a loss of events, even if the actual GRB was located within the AOI. Therefore the radius of the AOI will be the statistical error added in quadrature with 2° (PSF, 68% containment for 300 MeV) and 3° (systematic error). If GRB localization was provided also by other detectors, not only the GBM, then the systematic uncertainty was set to 0°. As a figure of merit roughly two thirds of all observed GeV photons of the GBM-detected bursts are expected to lie within the angular radius 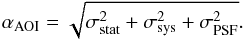 (1)As we sum the number of gamma-ray events over many GRBs, the global photon-detection efficiency is approximately two thirds.
3. Sample definition
For the analysis we used a sample of GRBs detected by the GBM from the beginning of the normal science operation of the Fermi satellite on August 4, 2008, until July 9, 2010, as listed in Paciesas et al. (2012). In this time interval, 472 bursts triggered the GBM. Some of these GRBs have to be excluded because they did not lie in the field of view (FoV) of the LAT or were not observed during the normal science operation of Fermi. It is also useful to exclude certain GRBs that are expected to have a low signal-to-background ratio. After applying all cuts 99 bursts remain. Fourteen of them have been previously detected by the LAT.
3.1. LAT field of view
The GBM can detect GRBs in almost every direction. On the other hand, the LAT has an FoV of ~2.4 sr at 1 GeV after all analysis cuts for background rejection have been made (Atwood et al. 2009). This means that only some of the GRBs detected by the GBM are actually in the FoV of the LAT and therefore detectable by it. The sensitivity in terms of the effective area is a decreasing function of the angle θ between the photon arrival direction and the LAT boresight. Photons arriving at θ ≳ 75° likely escape detection. It is therefore useful to concentrate only on GRBs where the angle between the GRB position and the LAT boresight during the observation was ≤70°.
3.2. Data quality
Some GRBs have to be rejected because of the quality of the data even if they are in the FoV of the LAT. As recommended by the LAT team, Fermi is required to be outside the South Atlantic Anomaly (SAA) and in normal science data-taking mode during the observation time. Additionally, an Earth-relative zenith-angle cut of 100° is imposed to prevent the spill-in of emission from the Earth’s limb. All bursts are required to fulfill this criterion at least in a time interval of 10 × T90 starting from the beginning of the T90 time.
3.3. Background emission
To avoid a large number of background photons it is reasonable to exclude certain regions of sky that are known to have a particularly high background intensity in the high-energy region. The dominant background sources are diffuse emission from the galactic plane, as well as bright gamma-ray sources like pulsars. It has been found that the photon intensity at GeV energies increases by roughly two orders of magnitude when observing the galactic plane (Ackermann et al. 2012b). Regions with a galactic latitude b of | b| < 5° + αAOI will be excluded, where αAOI is the radius of the AOI specified in Eq. (1). It is also useful to exclude regions around very bright gamma-ray sources. The most luminous ones are the Blazar 3C 454.3, the Vela Pulsar, the Crab Pulsar, the Geminga Pulsar, and the pulsars PSR J1709-4429 and PSR J2021+4026. The angular separation to these sources is required to be at least 1° + αAOI. Except for the blazar 3C 454.3, all these sources lie within the galactic plane and have already been excluded.
3.4. Localization error
Finally it is also useful to exclude GRBs with a high localization error because a large AOI with correspondingly high total background would have to be considered. By requiring that the statistical error radius be smaller than 5°, the number of samples is decreased by a factor of ~2/3. There is a correlation between the statistical error radius and the fluence. Therefore, mostly faint bursts are rejected by applying this cut on the error angle.
4. Method
4.1. Modeling the background
The Fermi Science Tools are used for the analysis of the bursts. Although the background emission is almost negligible for the duration of a single GRB, it becomes crucial when summing over many GRBs. The main sources of background radiation are the galactic and extragalactic diffuse emission, misclassified events, and individual sources like pulsars.
Using binned likelihood analysis we construct a model of instrumental background and the gamma-ray sky by fitting data obtained in a time interval of 3 × 10⁶ s until one hour before the trigger time of each burst. The pointing history of the spacecraft during the emission phase of the GRB then permits a prediction of the expected background for each burst. The event files and the spacecraft files are available at the Fermi mission website1. The LAT has different instrument response functions (IRFs). The IRFs differ especially in the efficiency in terms of the effective area, the PSF, and the energy dispersion. As recommended by the LAT team the P7SOURCE_V6 class is used with the corresponding galactic diffuse model (gal_2yearp7v6_v0) and isotropic spectral template (iso_p7v6source). It offers very high data quality with low background from misclassified photons and a fairly large effective area.
The region of interest (ROI) for modeling the background emission is a circle around the burst location with a radius of 22°; the energy range is 300 MeV to 30 GeV. Only time intervals are used for the analysis during which the LAT was not in the SAA, in normal science-operation mode and in the normal range of rocking angles of not more than 52°. Additionally, the ROI is required to not overlap with the Earth’s limb. The point and extended sources are listed in the Fermi LAT Second Source Catalog, which is based on two years of observations (Nolan et al. 2012). As recommended by the LAT team, ten energy bins per decade and angular pixels of size 0.2 degrees are used. A first fit is performed with the DRMNGB optimizer, and the result is then used for a second fit with the NEWMINUIT optimizer to get more precise results.
4.2. Analysis of the emission phase
The P7SOURCE_V6 class is also used for the analysis of the emission phase. The number of expected background photons is calculated by computing an exposure map for the AOI. In this case the exposure map describes how each source at the sky contributes to the observed photon counts inside the AOI. It is defined as 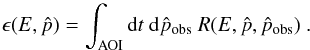 (2)where E is the energy,
  and
and  the true and observed direction, and R the response derived from the IRFs. This can be used to estimate the background photons inside the AOI from the background model. Energy dispersion has been neglected in this step. To get an estimate of the fluence of the GRB, the exposure has to be estimated. The possible GRB positions are distributed throughout the AOI. The best estimate for the exposure of the GRB is the integral of the exposure convolved with the distribution function φ of the expected localization errors (see for example Fig. 1).
 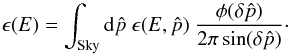 (3)In this way the error of the burst localization and the fact that some GRBs actually lie outside the AOI is automatically taken into account.
Number of observed photons (nobs) and the expected background (λ) for the GBM-detected bursts for the different time intervals.
5. Results
It is useful to first look at the raw photon counts in comparison to the number of expected photons for GRBs not detected by the LAT. The results are shown in Table 1. As we can see there is significant emission in the time interval from zero to ten times the T90 time. In this time λ = 14.97 photons are expected and n = 39 observed. The chance probability for a background fluctuation is 1.7 × 10⁻⁷, based on Poisson statistics  (4)This is a significant signal when summed over all GRBs but clearly not significant for a single burst for which the number of observed counts is typically smaller than one and the number of observed photons mostly zero or one. For the 11 observed short bursts (T90 < 2 s) there was one observed photon and 0.06 expected background photons, which is too low a signal to claim any detection. For the remaining 74 long bursts (T90 > 2 s) there were 38 observed photons and 14.91 expected from background. Before the GRB trigger we observe 5 events and expect 5.25. Later than 25 T90 after trigger, we observe 10 events and expect 7.15, indicating that there is little, if any, emission at that late stage, and no evidence of any activity before the GBM trigger.
5.1. Detection significance
One can search for significant signals of single GRBs in these data. For this purpose the number of observed and predicted photons are compared for the four time intervals between zero to ten T90, as well as the total time interval. As a cross-check the LAT-detected bursts will also be tested with the same method. 99 bursts are tested for 5 different time intervals, and therefore we have at most 495 trials, because the time intervals are not all independent. Therefore the probability that the background emission, λ, reaches or exceeds the observed emission, nobs, by normal fluctuations should be less than 10-4 for a 5% post-trial chance probability. All 14 bursts previously detected by the LAT show a significant signal in at least one time interval. This is not surprising because these bursts actually triggered the LAT and also have high-precision localizations either by the LAT or other observatories. However there were two other bursts with significant emission: GRB 100207B and GRB 081009A. The latter has also been reported as a candidate for a LAT-detected burst with the same method but with a wider energy range (E > 100 MeV) and longer observations times (tobs = 1500 s) (Rubtsov et al. 2012). However, it has not been added to the LAT Burst catalog so far. The results of this analysis are shown in Table 2.
Results for the two GRBs not listed in the LAT Burst catalog that show significant emission in the analysis.
5.2. Photon fluence
The average photon fluence of GRBs can be calculated by separately summing the exposure and the observed photon and expected background counts in every energy bin. To estimate the cumulative exposure over the entire energy range between 300 MeV and 30 GeV, we assume the emission follows a power law with an index of −2.3. As we see below, this index is appropriate for LAT-detected GRBs, whereas the average emission of GBM-detected bursts is better described with a power-law index of −3, in which case the photon fluence would be underestimated by about 10%. The 68%-confidence statistical uncertainty of the fluence has been calculated using an incomplete gamma function, i.e. the Bayesian inversion of a Poisson distribution for a uniform prior, and is considerably larger than the systematic uncertainty in estimating the fluence. The analysis has been done for the GBM- and LAT-detected bursts separately. The result is shown in Table 3 and graphically displayed in Fig. 2.
Photon fluences for different time intervals around the start of the T90 time interval.
Both GBM- and LAT-detected bursts show GeV-band emission long after the bulk of emission in the BATSE energy range (50 keV to 300 keV), which arises during the T90 time. Whereas the high-energy photon fluence in the T90 time interval from the GBM-detected bursts is  , we find an average photon fluence from the GBM-detected GRBs of
  for the time interval from 0 to 25 times T90. Given that there could still be emission at later times, which is just too low to be detected, the observed fluence during the T90 time is at most
  of the total GeV-band emission. One has to keep in mind that this is the average fluence weighted with the effective area of each burst. Since the Fermi satellite occasionally reorients for a very bright burst, our method may favor bright bursts, especially for later times.
 |
Fig. 2 Average fluences for different time intervals in units of T90. Shown in black (gray) are the average fluences for the GBM-detected (LAT-detected) bursts. The fluences for the LAT detected bursts were scaled by a factor of 10-2 to fit on the same plot. |
The photon fluence has also been separately calculated and listed in Table 4 for all LAT-detected bursts using the data from zero to ten times the T90 time interval. The results thus derived are comparable to those previously found with standard methods. The Burst Catalog (Paciesas et al. 2012) can be used to compare the fluence in the high-energy region from 300 MeV to 30 GeV to the one in the BATSE range from 50 keV to 300 keV obtained with the GBM. To be noted from Table 4 is that the bursts not detected by the LAT are fainter in the high-energy region than the LAT-detected GRBs when normalized to the same keV-band fluence.
5.3. Average flux from GRBs
We now determine the average emission from GRBs in the energy range from 300 MeV to 30 GeV. GRBs not detected by the LAT contribute with a fluence of 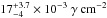 , whereas LAT-detected GRBs account for a fluence of
 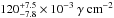 . The total observed fluence in the range from 300 MeV to 30 GeV is therefore
 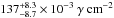 . Since 50% of the observed fluence comes from only two GRBs (GRB 090902B and GRB 090926A), the statistical error on this estimate should be roughly
  .
.
To estimate the average allsky flux of GRB-produced GeV-band gamma rays one has to consider all cuts applied in the analysis. First, some bursts were discarded on account of data quality as discussed in Sect. 3.2. This affected 27% of all available bursts giving a weight factor of 1.37. Then, the 5° cut on the statistical error radius of the burst location was compensated for by an additional factor. The bursts excluded in this step account for 3% of the overall fluence observed in the GBM energy range. This gives a factor of 1.03, assuming that the fluences in the GBM energy range and in the LAT energy range are proportional. (We find less GeV emission than that, therefore the true correction factor is somewhere between 1 and 1.03). Finally, the limitation to bursts that occurred in the LAT FoV (θ ≤ 70°) and were not too close to the galactic plane and the Blazar 3C 454.3 was compensated for with a factor of 3.46. We combined the three correction factors to derive the total efficiency factor as 4.88 = 3.46 × 1.03 × 1.37. The total high-energy fluence over the entire sky should therefore be (6.69 ± 2.37) × 10-1 γ cm-2. The effective observation time from August 4, 2008, until July 9, 2010, was 5.083 × 10⁷ s, so that the total averaged flux from all bursts over the entire sky in the energy range from 300 MeV to 30 GeV is (13.2 ± 4.7) × 10-9 γ cm-2 s-1.
Comparison of the fluences from several LAT-detected bursts and the average fluence for the 85 GBM-detected bursts with the fluences in the BATSE range.
We have also determined the energy fluence from GRBs. GRBs not detected by the LAT contribute with a fluence of 1.67 × 10⁻⁵ erg cm-2, whereas LAT-detected GRBs account for a fluence of 1.93 × 10⁻⁴ erg cm-2. The average photon energies are ~1 GeV for LAT-detected GRBs and ~0.6 GeV for GBM-detected bursts, estimated as the ratio of the energy fluence and the photon fluence. If the emission spectra were power laws, then the spectral indices, s, would be sLAT ≃ 2.3 and sGBM ≃ 3.
The average allsky energy flux is about 6.4 × 10⁻⁴ erg cm-2 yr-1, slightly larger than the estimate of Eichler et al. (2010), but still compatible with it, considering the uncertainties.
6. Summary and discussion
In this study of high-energy emission from GRBs in the range from 300 MeV to 30 GeV the focus has been placed on GRBs not individually detected by the LAT and referred to as GBM detected. We defined a sample of 85 GRBs listed in the GBM catalog, 74 of which can be regarded as long bursts (T90 > 2 s), while the remaining 11 GRBs are short (T90 < 2 s) bursts. We find significant emission above the background for the complete sample. For the long bursts the emission is clearly visible, while the results are statistically inconclusive for the short bursts alone. Moreover, the GeV-band emission lasts considerably longer than the T90 time of the keV–MeV energy range, in fact at least up to ten times T90. A similar conclusion has previously been reported for individual GRBs, such as GRB 080916C (Abdo et al. 2009), GRB 081024B (Abdo et al. 2010) or GRB 940217 (Hurley et al. 1994). Altogether only (12 ± 7)% of the total photon fluence in the range from 300 MeV to 30 GeV is emitted during T90. Since this extended emission was observed when summing over many GRBs, we cannot distinguish between continous emission and a sequence of flares. Given that the number of GRBs in the sample is larger than the number of observed photons, it is also unclear whether this delayed emission is a general feature or the product of a subset of GRBs.
The ratio of the fluence in the high-energy region to the fluence in the BATSE energy region is lower (6 × 10⁻⁵) for the bursts not detected by the LAT than for LAT-detected bursts (4.7 × 10⁻⁴). The estimated spectra in the GeV band are softer for GBM-detected bursts (with equivalent photon index s ≃ 3) than for LAT-detected bursts (equivalent photon index s ≃ 2.3). There is no indication that GRBs produce particle spectra with typical indices s ≃ 2 that are often assumed in source models of ultra-high-energy cosmic rays. Likewise, there is no evidence of a population of GRBs that efficiently accelerate particles to high energies but individually emit too weakly in the GeV band for a detection with Fermi-LAT.
Altogether, the bursts not detected by the LAT contribute roughly 14% of all GRB-produced photons, and 8% of the emitted energy, in the energy range from 300 MeV to 30 GeV. Finally, we find that the average allsky gamma-ray flux coming from GRBs in this energy range is (13.16 ± 4.65) × 10-9 γ cm-2 s-1. The average allsky energy flux from GRBs in the GeV band is only ~4% of the energy flux of cosmic rays above the ankle at 1018.6 eV.
Acknowledgments
We acknowledge support by the Helmholtz Alliance for Astroparticle Physics HAP funded by the Initiative and Networking Fund of the Helmholtz Association.
References
- Abdo, A. A., Ackermann, M., Arimoto, M., et al. 2009, Science, 323, 1688 [Google Scholar]
- Abdo, A. A., Ackermann, M., Ajello, M., et al. 2010, ApJ, 712, 558 [NASA ADS] [CrossRef] [Google Scholar]
- Abdo, A. A., Ackermann, M., Ajello, M., et al. 2011, ApJ, 734, L27 [NASA ADS] [CrossRef] [Google Scholar]
- Ackermann, M., Ajello, M., Albert, A., et al. 2012a, ApJS, 203, 4 [NASA ADS] [CrossRef] [Google Scholar]
- Ackermann, M., Ajello, M., Atwood, W. B., et al. 2012b, ApJ, 750, 3 [NASA ADS] [CrossRef] [Google Scholar]
- Ackermann, M., Ajello, M., Baldini, L., et al. 2012c, ApJ, 754, 121 [NASA ADS] [CrossRef] [Google Scholar]
- Atwood, W. B., Abdo, A. A., Ackermann, M., et al. 2009, ApJ, 697, 1071 [NASA ADS] [CrossRef] [Google Scholar]
- Eichler, D., & Levinson, A. 2000, ApJ, 529, 146 [NASA ADS] [CrossRef] [Google Scholar]
- Eichler, D., & Pohl, M. 2011, ApJ, 738, L21 [NASA ADS] [CrossRef] [Google Scholar]
- Eichler, D., Guetta, D., & Pohl, M. 2010, ApJ, 722, 543 [NASA ADS] [CrossRef] [Google Scholar]
- Gehrels, N., Ramirez-Ruiz, E., & Fox, D. B. 2009, ARA&A, 47, 567 [NASA ADS] [CrossRef] [Google Scholar]
- Hurley, K., Dingus, B. L., Mukherjee, R., et al. 1994, Nature, 372, 652 [NASA ADS] [CrossRef] [Google Scholar]
- Kotera, K., & Olinto, A. V. 2011, ARA&A, 49, 119 [Google Scholar]
- Meegan, C., Lichti, G., Bhat, P. N., et al. 2009, ApJ, 702, 791 [NASA ADS] [CrossRef] [Google Scholar]
- Nolan, P. L., Abdo, A. A., Ackermann, M., et al. 2012, ApJS, 199, 31 [NASA ADS] [CrossRef] [Google Scholar]
- Paciesas, W. S., Meegan, C. A., von Kienlin, A., et al. 2012, ApJS, 199, 18 [NASA ADS] [CrossRef] [Google Scholar]
- Pe’er, A.,Zhang, B.-B., Ryde, F., et al. 2012, MNRAS, 420, 468 [NASA ADS] [CrossRef] [Google Scholar]
- Rando, R. 2009 [arXiv:0907.0626] [Google Scholar]
- Rubtsov, G. I., Pshirkov, M. S., & Tinyakov, P. G. 2012, MNRAS, 421, L14 [NASA ADS] [Google Scholar]
- Ryde, F., & Pe’er, A. 2009, ApJ, 702, 1211 [NASA ADS] [CrossRef] [Google Scholar]
- Waxman, E. 2010 [arXiv:1010.5007] [Google Scholar]
- Zheng, W., Akerlof, C. W., Pandey, S. B., et al. 2012a, ApJ, 745, 72 [NASA ADS] [CrossRef] [Google Scholar]
- Zheng, W., Akerlof, C. W., Pandey, S. B., et al. 2012b, ApJ, 756, 64 [NASA ADS] [CrossRef] [Google Scholar]
All Tables
Number of observed photons (nobs) and the expected background (λ) for the GBM-detected bursts for the different time intervals.
Results for the two GRBs not listed in the LAT Burst catalog that show significant emission in the analysis.
Photon fluences for different time intervals around the start of the T90 time interval.
Comparison of the fluences from several LAT-detected bursts and the average fluence for the 85 GBM-detected bursts with the fluences in the BATSE range.
All Figures
|
Fig. 1 Expected GBM localization accuracy for 1° (dashed), 5° (fine dashed) and 10° (continous) statistical error radius. A normal distribution is assumed for the statistical error. |
| In the text | |
|
Fig. 2 Average fluences for different time intervals in units of T90. Shown in black (gray) are the average fluences for the GBM-detected (LAT-detected) bursts. The fluences for the LAT detected bursts were scaled by a factor of 10-2 to fit on the same plot. |
| In the text | |
Current usage metrics show cumulative count of Article Views (full-text article views including HTML views, PDF and ePub downloads, according to the available data) and Abstracts Views on Vision4Press platform.
Data correspond to usage on the plateform after 2015. The current usage metrics is available 48-96 hours after online publication and is updated daily on week days.
Initial download of the metrics may take a while.